

Question: ..,...-U_.._.-, ...-.. .- ... -__._ .-..~..uv-- 1. The marital status distribution of the US. male population, ages 15 and older, is as follows: 35.4% never
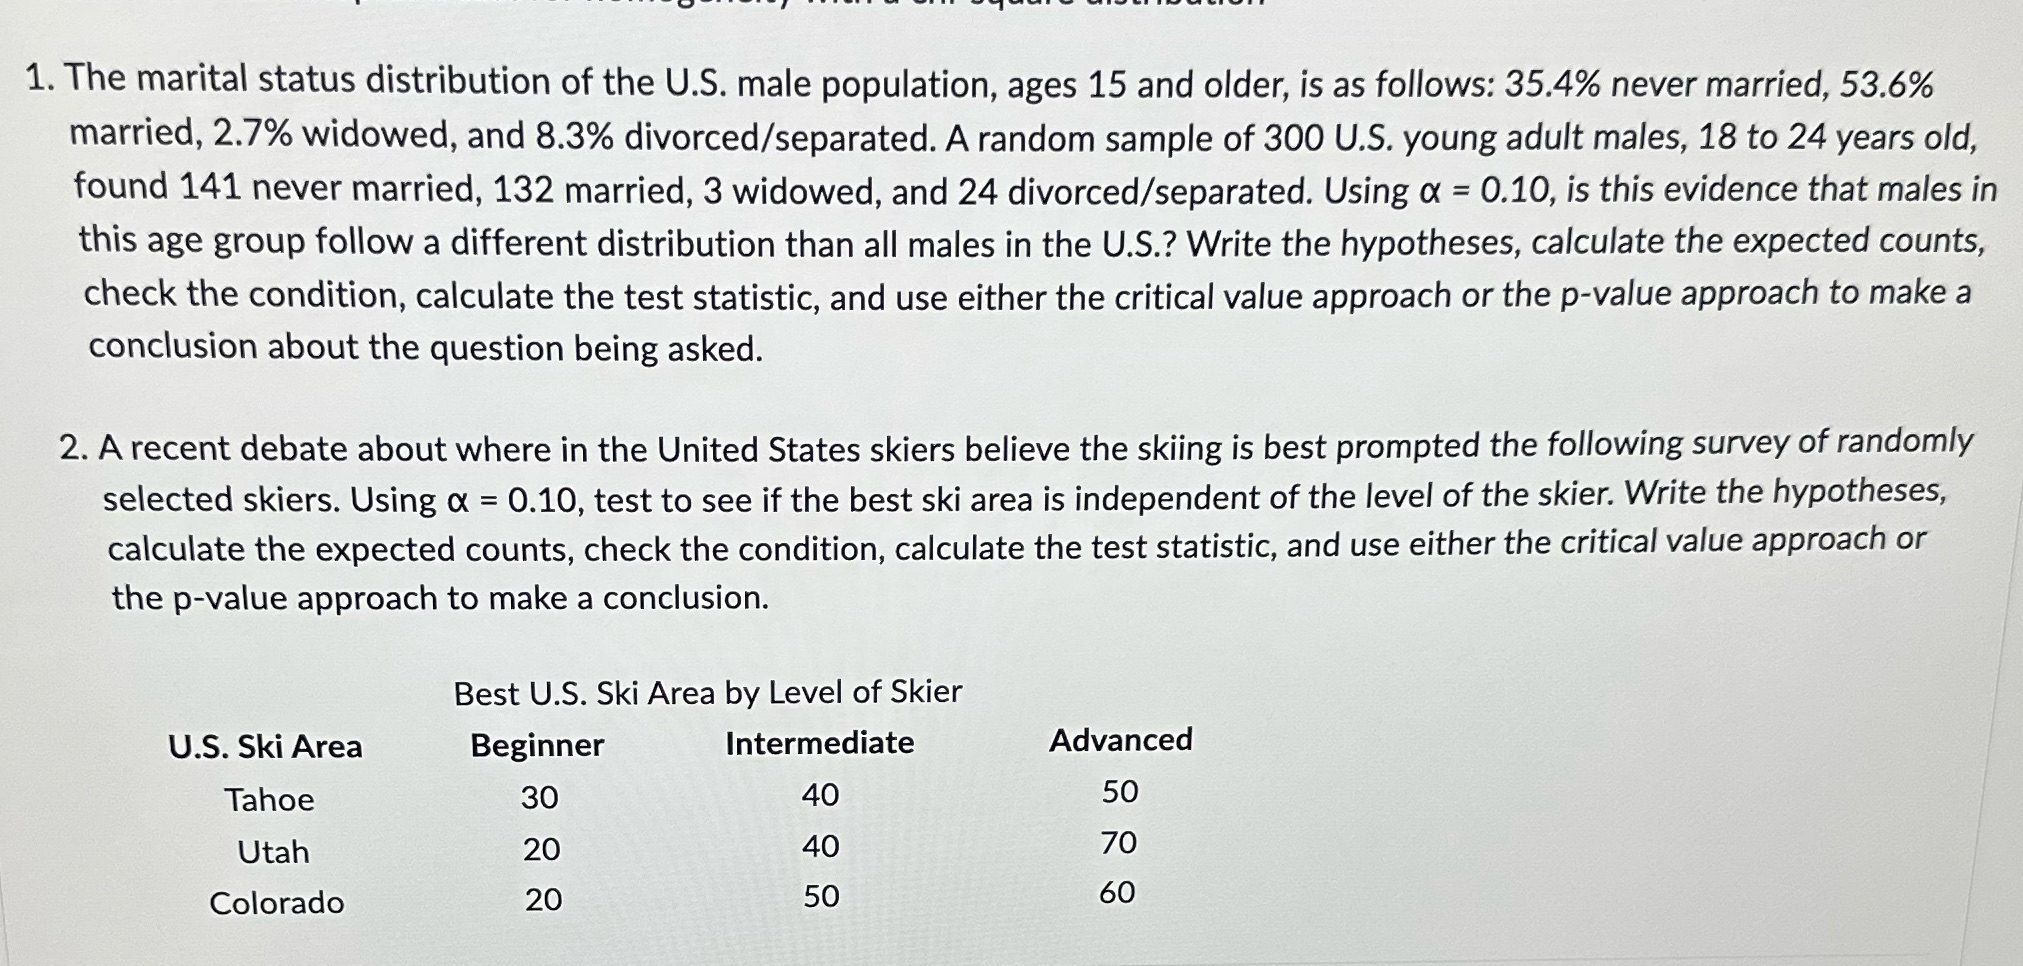
..,...-U_.._.-, ...-.. .- ... -__._ .-..~..uv-- 1. The marital status distribution of the US. male population, ages 15 and older, is as follows: 35.4% never married, 53.6% married, 2.7% widowed, and 8.3% divorced/separated. A random sample of 300 US. young adult males, 18 to 24 years old, found 141 never married, 132 married, 3 widowed, and 24 divorced/separated. Using or = 0.10, is this evidence that males in this age group follow a different distribution than all males in the U.S.? Write the hypotheses, calculate the expected counts, check the condition, calculate the test statistic, and use either the critical value approach or the p-value approach to make a conclusion about the question being asked. 2. A recent debate about where in the United States skiers believe the skiing is best prompted the following survey of randomly selected skiers. Using or = 0.10, test to see if the best ski area is independent of the level of the skier. Write the hypotheses, calculate the expected counts, check the condition, calculate the test statistic, and use either the critical value approach or the p-value approach to make a conclusion. Best U.S. Ski Area by Level of Skier US. Ski Area Beginner Intermediate Advanced Tahoe 30 40 50 Utah 20 4O 70 Colorado 20 50 60
Step by Step Solution
There are 3 Steps involved in it

Get step-by-step solutions from verified subject matter experts