

Question: 1) Forest Preservation (50 Points) The figure below represents the average plot size and layout for a Pennsylvania farmer with 800 acres of forest on

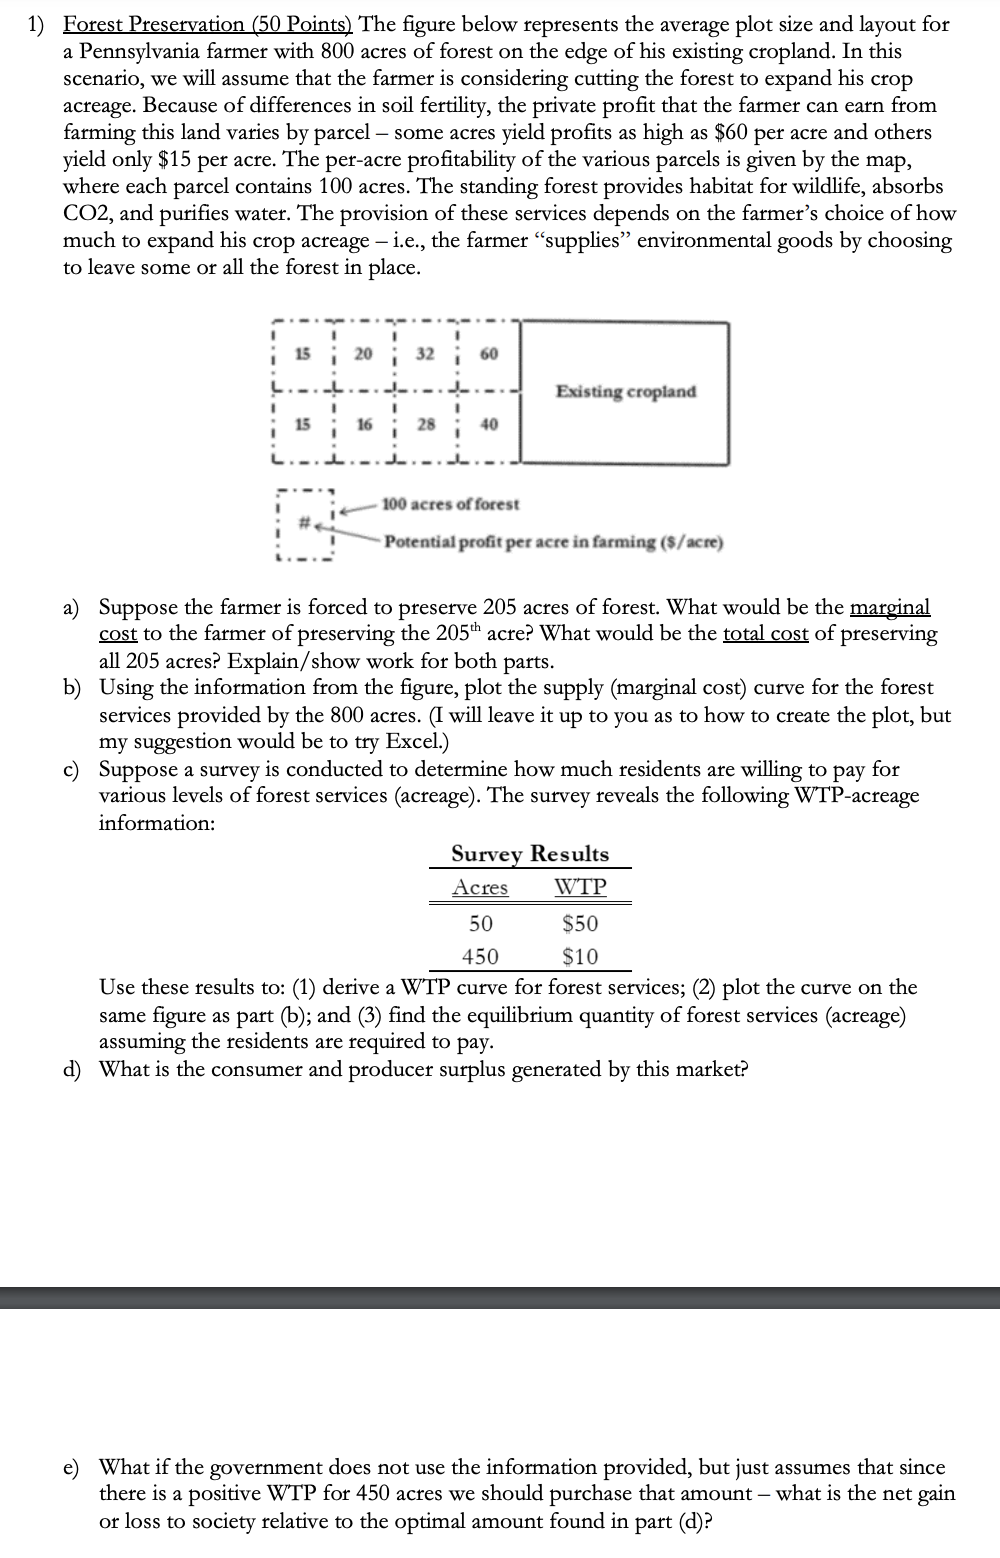
1) Forest Preservation (50 Points) The figure below represents the average plot size and layout for a Pennsylvania farmer with 800 acres of forest on the edge of his existing cropland. In this scenario, we will assume that the farmer is considering cutting the forest to expand his crop acreage. Because of differences in soil fertility, the private profit that the farmer can earn from farming this land varies by parcel some acres yield profits as high as $60 per acre and others yield only $15 per acre. The per-acre profitability of the various parcels is given by the map, where each parcel contains 100 acres. The standing forest provides habitat for wildlife, absorbs CO2, and purifies water. The provision of these services depends on the farmer's choice of how much to expand his crop acteage i.e., the farmer \"supplies\" environmental goods by choosing to leave some or all the forest in place. - | | bo :| Lowdh e e Existing cropland i ' o 100 acres of forest # ot l.' = Potential profit per acre in farming ($/acre) a) Suppose the farmer is forced to preserve 205 acres of forest. What would be the marginal cost to the farmer of preserving the 205" acre? What would be the total cost of preserving all 205 acres? Explain/show work for both patts. b) Using the information from the figure, plot the supply (marginal cost) curve for the forest services provided by the 800 acres. (I will leave it up to you as to how to create the plot, but my suggestion would be to try Excel.) ) Suppose a survey is conducted to determine how much residents are willing to pay for various levels of forest services (acreage). The survey reveals the following WTP-acreage information: Survez Results Acres WTP 50 S50 450 S10 Use these results to: (1) derive a WTP curve for forest services; (2) plot the curve on the same figure as part (b); and (3) find the equilibrium quantity of forest services (acreage) assuming the residents are required to pay. d) What is the consumer and producer surplus generated by this market? e) What if the government does not use the information provided, but just assumes that since there is a positive WTP for 450 actes we should purchase that amount what is the net gain or loss to society relative to the optimal amount found in part (d)
Step by Step Solution
There are 3 Steps involved in it

Get step-by-step solutions from verified subject matter experts