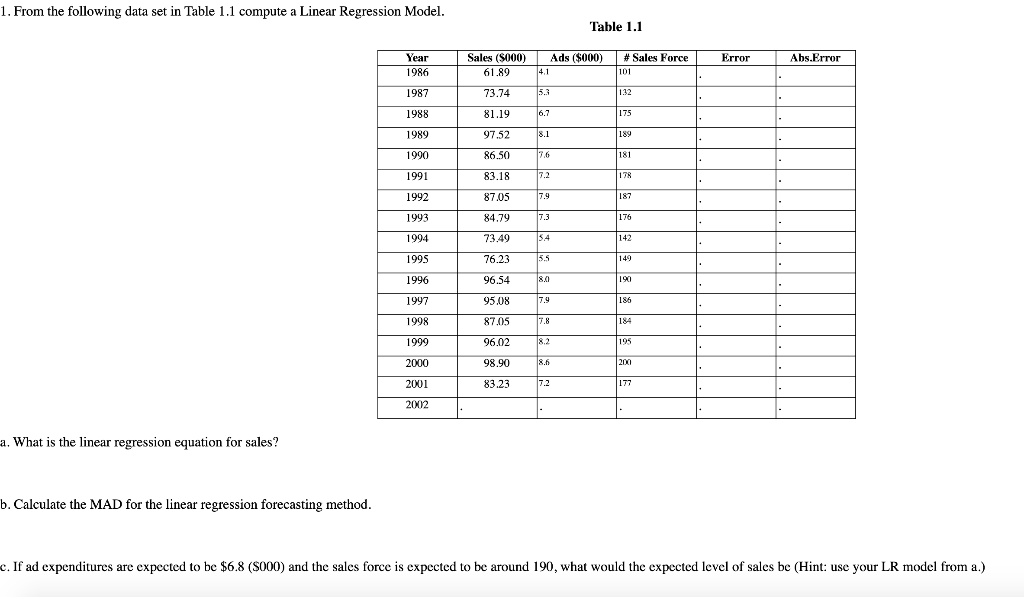
Question: 1. From the following data set in Table 1.1 compute a Linear Regression Model. Table 1.1 Year # Sales Force Error Abs.Error 1986 1987 1988

1. From the following data set in Table 1.1

1. From the following data set in Table 1.1 compute a Linear Regression Model. Table 1.1 Year # Sales Force Error Abs.Error 1986 1987 1988 1989 1990 1991 1992 1993 Sales (S000) Ads ($000) 61.89 4.1 73.74 5.3 81.19 6.7 97.52 3.1 86.50 83.18 7.2 87.05 7.9 84.797.3 73.49 3.4 76.23 5.5 96.54 8.0 95.08 87.05 96.02 $2 98.90 8.6 83.23 7.2 1994 1995 1996 1997 1998 1999 2000 2001 2002 a. What is the linear regression equation for sales? b. Calculate the MAD for the linear regression forecasting method. c. If ad expenditures are expected to be $6.8 (5000) and the sales force is expected to be around 190, what would the expected level of sales be (Hint: use your LR model from a.) 1. From the following data set in Table 1.1 compute a Linear Regression Model. Table 1.1 Year # Sales Force Error Abs.Error 1986 1987 1988 1989 1990 1991 1992 1993 Sales (S000) Ads ($000) 61.89 4.1 73.74 5.3 81.19 6.7 97.52 3.1 86.50 83.18 7.2 87.05 7.9 84.797.3 73.49 3.4 76.23 5.5 96.54 8.0 95.08 87.05 96.02 $2 98.90 8.6 83.23 7.2 1994 1995 1996 1997 1998 1999 2000 2001 2002 a. What is the linear regression equation for sales? b. Calculate the MAD for the linear regression forecasting method. c. If ad expenditures are expected to be $6.8 (5000) and the sales force is expected to be around 190, what would the expected level of sales be (Hint: use your LR model from a.)

Step by Step Solution

There are 3 Steps involved in it

1 Expert Approved Answer
Step: 1 Unlock blur-text-image
Question Has Been Solved by an Expert!

Get step-by-step solutions from verified subject matter experts

Step: 2 Unlock
Step: 3 Unlock

Students Have Also Explored These Related General Management Questions!