

Question: 1. Generate random real numbers that is uniformly distributed between 0 and 20. Generate 1000 numbers and plot the histogram. Compare it to the pdf
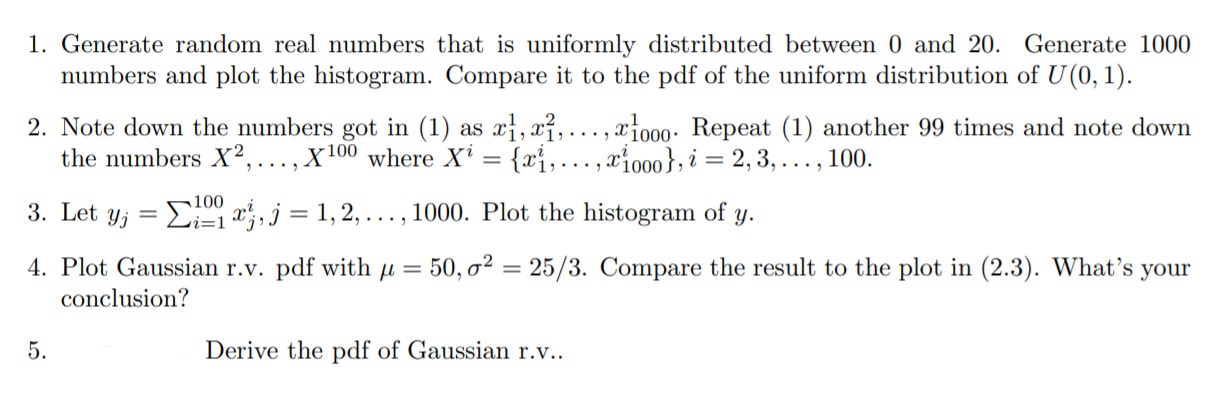
1. Generate random real numbers that is uniformly distributed between 0 and 20. Generate 1000 numbers and plot the histogram. Compare it to the pdf of the uniform distribution of U (0, 1). 2. Note down the numbers got in (1) as x], x], ..., Tooo. Repeat (1) another 99 times and note down the numbers X2, ..., X100 where Xi = {xi, ...,*1ooo), i = 2, 3, . .., 100. 3. Let yj = _121 x,, j = 1,2, ..., 1000. Plot the histogram of y. 4. Plot Gaussian r.v. pdf with / = 50, o2 = 25/3. Compare the result to the plot in (2.3). What's your conclusion? 5. Derive the pdf of Gaussian r.v
Step by Step Solution
There are 3 Steps involved in it
1 Expert Approved Answer
Step: 1 Unlock

Question Has Been Solved by an Expert!
Get step-by-step solutions from verified subject matter experts
Step: 2 Unlock
Step: 3 Unlock