

Question: Please Use R 1. Generate 200 random numbers using each of the following continuous distributions. Plot the histograms and overlay the pdf: Uniform (use A
Please Use R
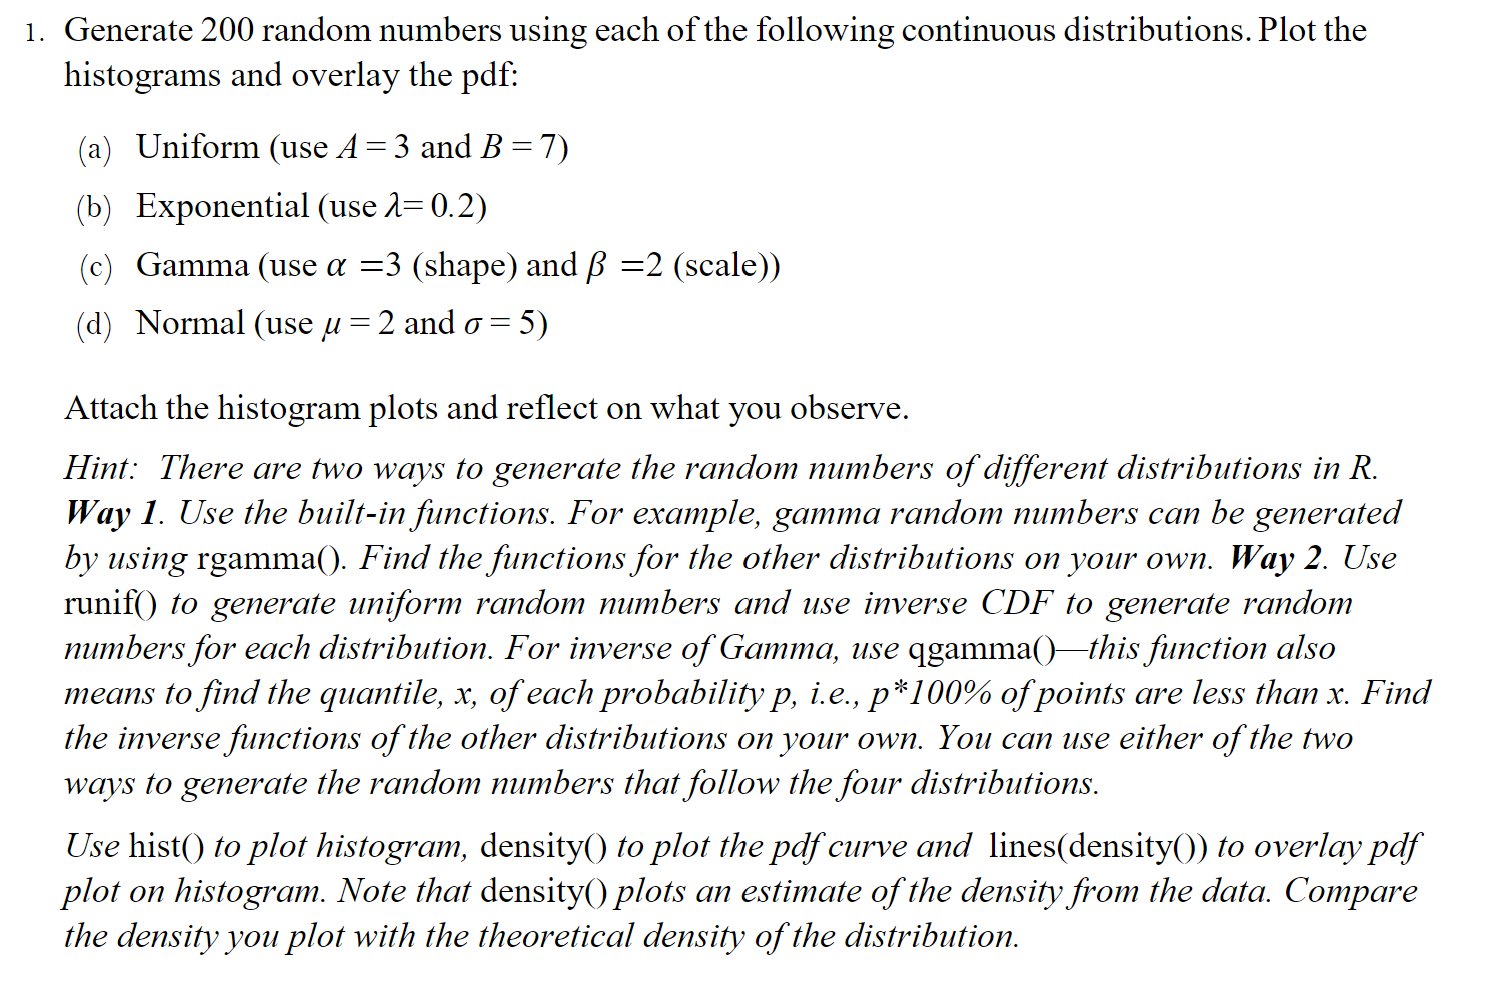
1. Generate 200 random numbers using each of the following continuous distributions. Plot the histograms and overlay the pdf: Uniform (use A : 3 and B : 7) Exponential (use A: 0.2) l l (c) Gamma (use n: =3 (shape) and i? =2 (scale)) ) Normal (use Ju : 2 and o : 5) Attach the histogram plots and reect on what you observe. Hint.\" There are two ways to generate the random numbers ofdierent distributions in R. Way 1. Use the built-in functions. For example, gamma random numbers can be generated by using rgamma(). Find the functions for the other distributions on your own. Way 2. Use runif() to generate uniform random numbers and use inverse CDF to generate random numbers for each distribution. For inverse of Gamma, use qgammaoithis function also means to nd the quantile, x, of each probability p, i. e., p*100% of points are less than A\". Find the inverse functions of the other distributions on your own. You can use either of the two ways to generate the random numbers that follow the four distributions. Use hist() to plot histogram, density() to plot the pdfeurve and lines(density()) to overlay pdf plot on histogram. Note that densityO plots an estimate of the density from the data. Compare the density you plot with the theoretical density of the distribution
Step by Step Solution
There are 3 Steps involved in it

Get step-by-step solutions from verified subject matter experts