

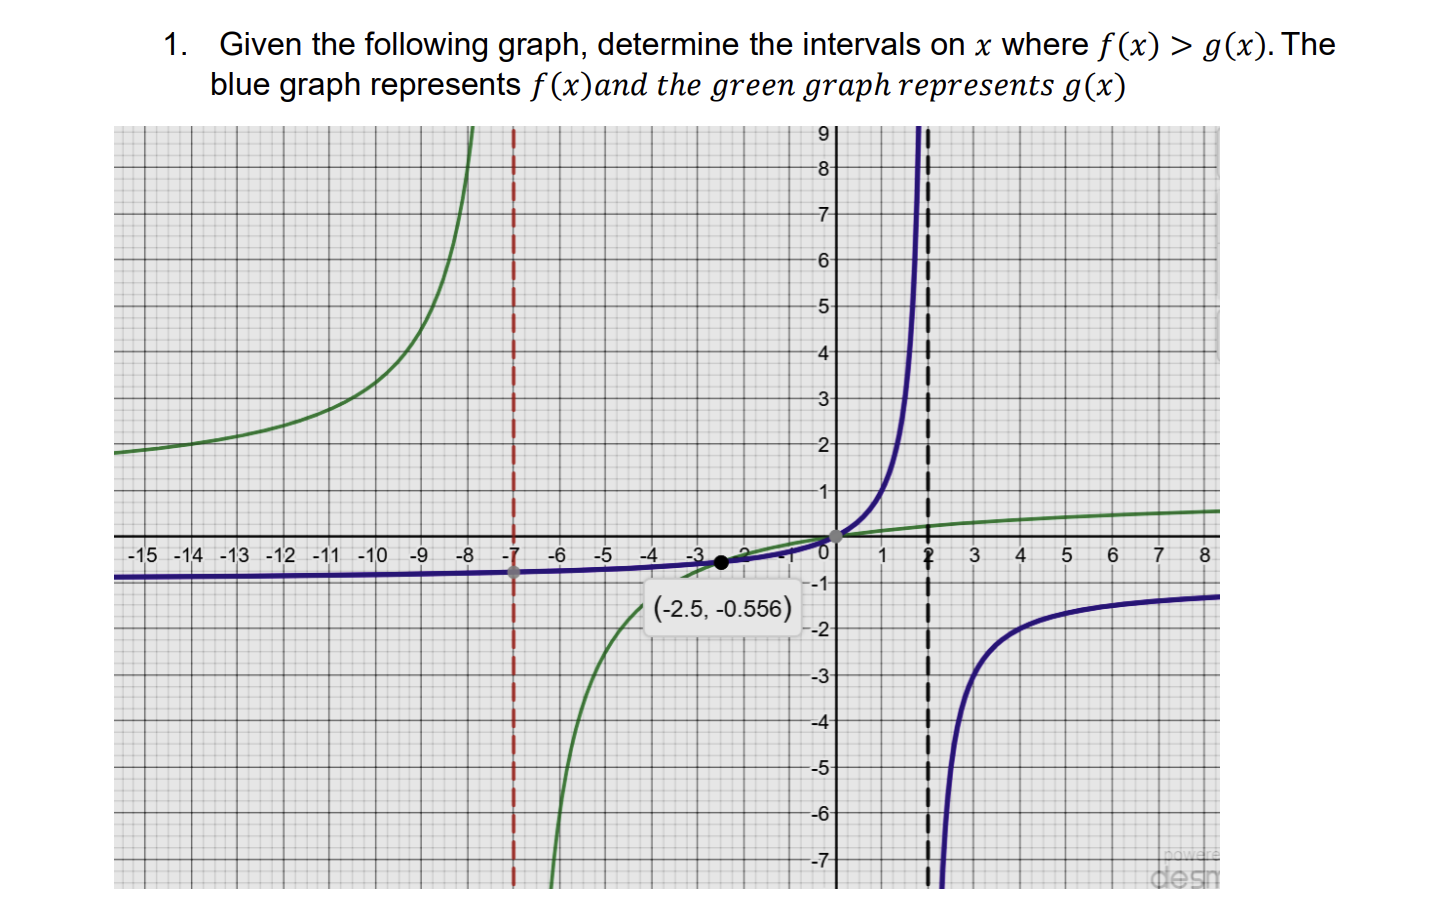
Question: 1. Given the following graph, determine the intervals on x where f (x) > g(x). The blue graph represents f (x) and the green graph
Step by Step Solution
There are 3 Steps involved in it
1 Expert Approved Answer
Step: 1 Unlock

Question Has Been Solved by an Expert!
Get step-by-step solutions from verified subject matter experts
Step: 2 Unlock
Step: 3 Unlock