

Question: 1. Given the information below determine if each variable (X, Y) has a pro or counter cyclical relationship with the real GDP growth rate and
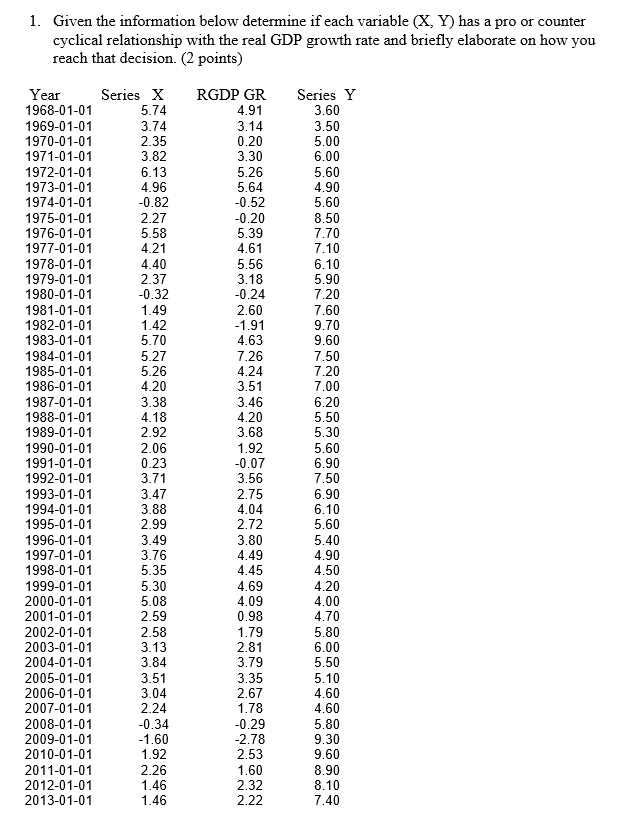
1. Given the information below determine if each variable (X, Y) has a pro or counter cyclical relationship with the real GDP growth rate and briefly elaborate on how you reach that decision. (2 points) Year 1968-01-01 Series X RGDP GR Series Y 5.74 4.91 3.60 1969-01-01 3.74 3.14 1970-01-01 3.50 2.35 0.20 5.00 1971-01-01 3.82 3.30 6.00 1972-01-01 1973-01-01 6.13 5.26 5.60 4.96 5.64 4.90 1974-01-01 -0.82 1975-01-01 -0.52 5.60 1976-01-01 2.27 -0.20 8.50 5.58 5.39 1977-01-01 4.21 7.70 4.61 1978-01-01 7.10 4.40 1979-01-01 5.56 6.10 1980-01-01 2.37 3.18 5.90 -0.32 -0.24 7.20 1981-01-01 1.49 1982-01-01 2.60 7.60 1.42 1983-01-01 5.70 -1.91 9.70 4.63 9.60 1984-01-01 1985-01-01 5.27 7.26 7.50 5.26 4.24 1986-01-01 7.20 4.20 3.51 7.00 1987-01-01 1988-01-01 3.38 3.46 4.18 6.20 1989-01-01 4.20 5.50 2.92 3.68 5.30 1990-01-01 2.06 5.60 1991-01-01 1.92 1992-01-01 0.23 -0.07 6.90 1993-01-01 3.71 3.56 7.50 3.47 2.75 6.90 1994-01-01 3.88 1995-01-01 4.04 6.10 2.99 2.72 5.60 1996-01-01 1997-01-01 3.49 3.80 5.40 3.76 4.49 4.90 1998-01-01 5.35 4.45 1999-01-01 4.50 2000-01-01 5.30 4.69 4.20 5.08 4.09 2001-01-01 4.00 2.59 0.98 2002-01-01 4.70 2003-01-01 2.58 1.79 2004-01-01 3.13 5.80 2.81 6.00 3.84 3.79 2005-01-01 5.50 2006-01-01 3.51 3.35 5.10 2007-01-01 3.04 2.24 2.67 1.78 4.60 4.60 2008-01-01 -0.34 2009-01-01 -0.29 5.80 2010-01-01 -1.60 -2.78 9.30 1.92 2.53 9.60 2011-01-01 2012-01-01 2.26 1.60 8.90 2013-01-01 1.46 2.32 8.10 1.46 2.22 7.40
Step by Step Solution
There are 3 Steps involved in it

Get step-by-step solutions from verified subject matter experts