

Question: 1. Given the information below determine if each variable (X, Y) has a pro or counter cyclical relationship with the real GDP growth rate and
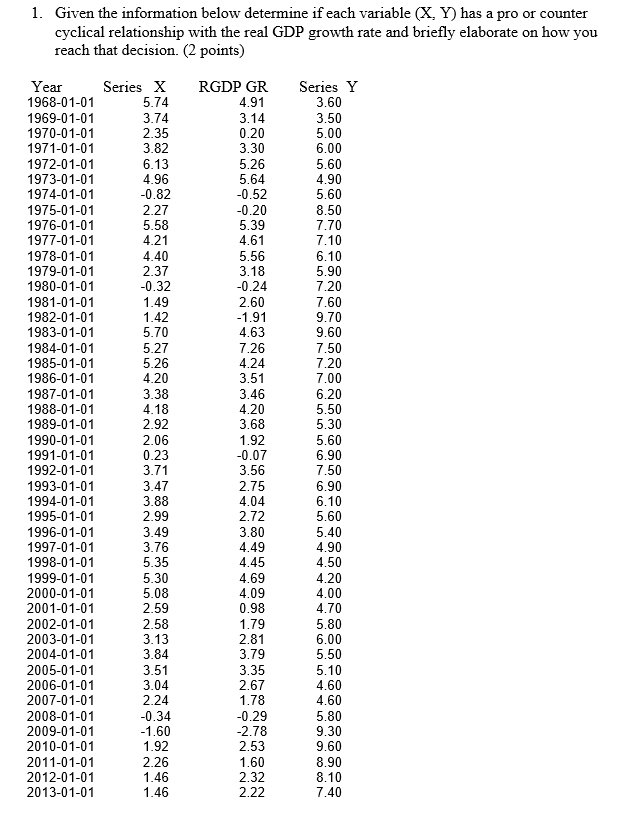
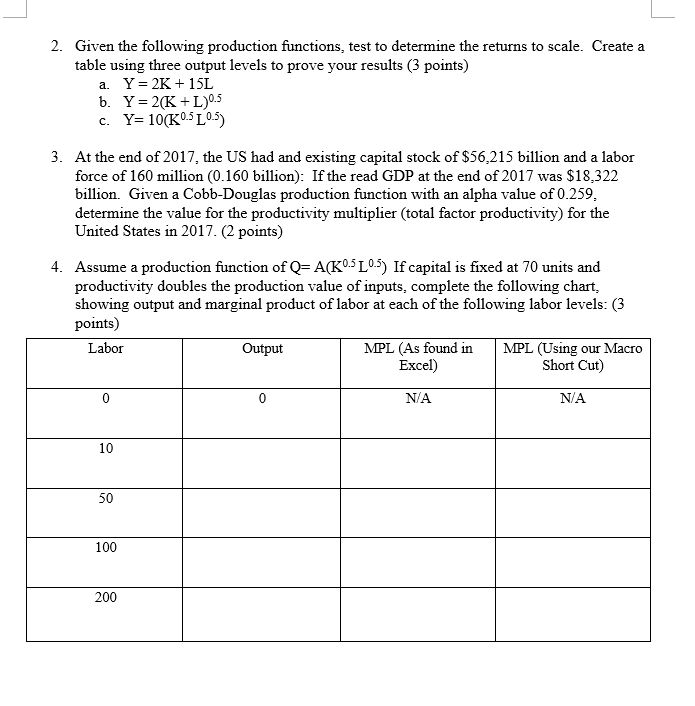
1. Given the information below determine if each variable (X, Y) has a pro or counter cyclical relationship with the real GDP growth rate and briefly elaborate on how you reach that decision. (2 points) Year Series X RGDP GR 1968-01-01 5.74 Series Y 4.91 3.60 1969-01-01 3.74 1970-01-01 3.14 2.35 3.50 0.20 5.00 1971-01-01 3.82 3.30 6.00 1972-01-01 6.13 5.26 5.60 1973-01-01 4.96 5.64 1974-01-01 4.90 -0.82 -0.52 5.60 1975-01-01 1976-01-01 2.27 5.58 -0.20 8.50 5.39 7.70 1977-01-01 4.21 4.61 7.10 1978-01-01 4.40 5.56 6.10 1979-01-01 2.37 3.18 1980-01-01 -0.32 5.90 -0.24 7.20 1981-01-01 2.60 1982-01-01 1.49 7.60 1.42 -1.91 9.70 1983-01-01 5.70 4.63 9.60 1984-01-01 5.27 7.26 7.50 1985-01-01 5.26 1986-01-01 4.24 7.20 4.20 3.51 7.00 1987-01-01 1988-01-01 3.38 3.46 4.18 4.20 6.20 1989-01-01 5.50 2.92 3.68 5.30 1990-01-01 2.06 1.92 5.60 1991-01-01 0.23 1992-01-01 -0.07 6.90 3.71 3.56 7.50 1993-01-01 3.47 2.75 6.90 1994-01-01 3.88 4.04 6.10 1995-01-01 2.99 2.72 5.60 1996-01-01 3.49 3.80 5.40 1997-01-01 3.76 4.49 1998-01-01 4.90 5.35 4.45 4.50 1999-01-01 5.30 4.69 2000-01-01 5.08 4.20 2001-01-01 4.09 4.00 2.59 0.98 4.70 2002-01-01 2.58 1.79 2003-01-01 5.80 3.13 2004-01-01 2.81 6.00 3.84 3.79 5.50 2005-01-01 3.51 3.35 2006-01-01 5.10 3.04 2.67 4.60 2007-01-01 2.24 1.78 2008-01-01 4.60 -0.34 -0.29 5.80 2009-01-01 2010-01-01 -1.60 -2.78 9.30 2.53 9.60 2011-01-01 1.92 2012-01-01 2.26 1.60 8.90 1.46 2013-01-01 2.32 8.10 1.46 2.22 7.402. Given the following production functions, test to determine the returns to scale. Create a table using three output levels to prove your results (3 points) a. Y = 2K + 15L b. Y = 2(K + L)0.5 c. Y= 10(K05 L 0.5) 3. At the end of 2017, the US had and existing capital stock of $56,215 billion and a labor force of 160 million (0.160 billion): If the read GDP at the end of 2017 was $18,322 billion. Given a Cobb-Douglas production function with an alpha value of 0.259. determine the value for the productivity multiplier (total factor productivity) for the United States in 2017. (2 points) 4. Assume a production function of Q= A(KOL-5) If capital is fixed at 70 units and productivity doubles the production value of inputs, complete the following chart, showing output and marginal product of labor at each of the following labor levels: (3 points) Labor Output MPL (As found in MPL (Using our Macro Excel) Short Cut) 0 0 N/A N/A 10 50 100 200
Step by Step Solution
There are 3 Steps involved in it

Get step-by-step solutions from verified subject matter experts