

Question: 1) Graph and label celsius on the x axis and kelvin on the y-axis 2)Did the water gain or lose heat? 3) what was the
1) Graph and label celsius on the x axis and kelvin on the y-axis
2)Did the water gain or lose heat?
3) what was the change in the water temperature? 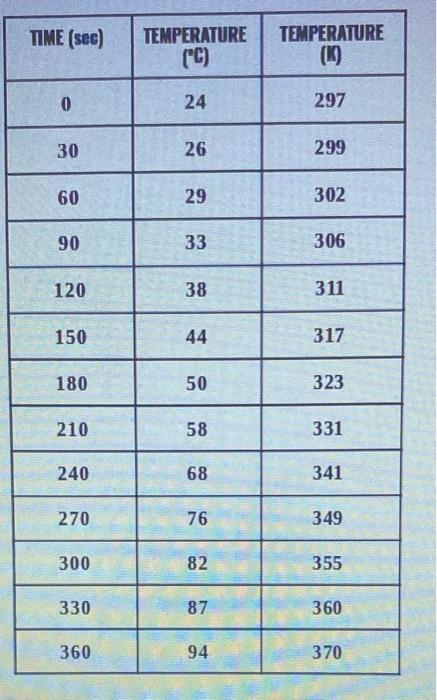
TIME (sec) TEMPERATURE (C) TEMPERATURE (19 0 24 297 30 26 299 60 29 302 90 33 306 120 38 311 150 44 317 180 50 323 210 58 331 240 68 341 270 76 349 300 82 355 330 87 360 360 94 370
Step by Step Solution
There are 3 Steps involved in it
1 Expert Approved Answer
Step: 1 Unlock

Question Has Been Solved by an Expert!
Get step-by-step solutions from verified subject matter experts
Step: 2 Unlock
Step: 3 Unlock