

Question: 1 graph for each chart please. so 2 graphs in total! Pipetting Practice Fe3(aq)+SCN(aq)FeSCN2(aq) Do experiment in groups of 4. Two students will do Part
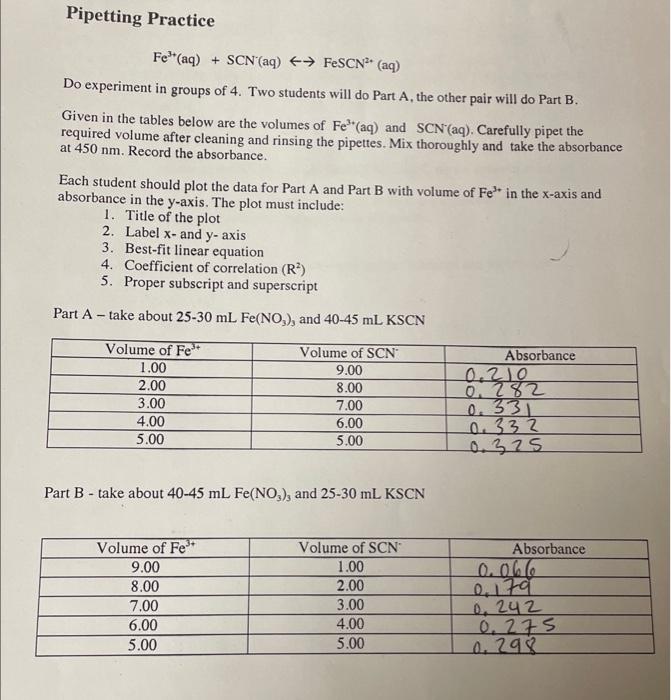
Pipetting Practice Fe3(aq)+SCN(aq)FeSCN2(aq) Do experiment in groups of 4. Two students will do Part A, the other pair will do Part B. Given in the tables below are the volumes of Fe3(aq) and SCN(aq). Carefully pipet the required volume after cleaning and rinsing the pipettes. Mix thoroughly and take the absorbance at 450nm. Record the absorbance. Each student should plot the data for Part A and Part B with volume of Fe3 in the X-axis and absorbance in the y-axis. The plot must include: 1. Title of the plot 2. Label x - and y-axis 3. Best-fit linear equation 4. Coefficient of correlation (R2) 5. Proper subscript and superscript Part A - take about 2530mLFe(NO3)3 and 4045mLKSCN Part B - take about 4045mLFe(NO3)3 and 2530mLKSCN
Step by Step Solution
There are 3 Steps involved in it

Get step-by-step solutions from verified subject matter experts