

Question: 1. Graph the demand curve using the demand data below. Product Quantity Price Demanded $25 45 $20 50 2. Using the midpoint formula for Ed
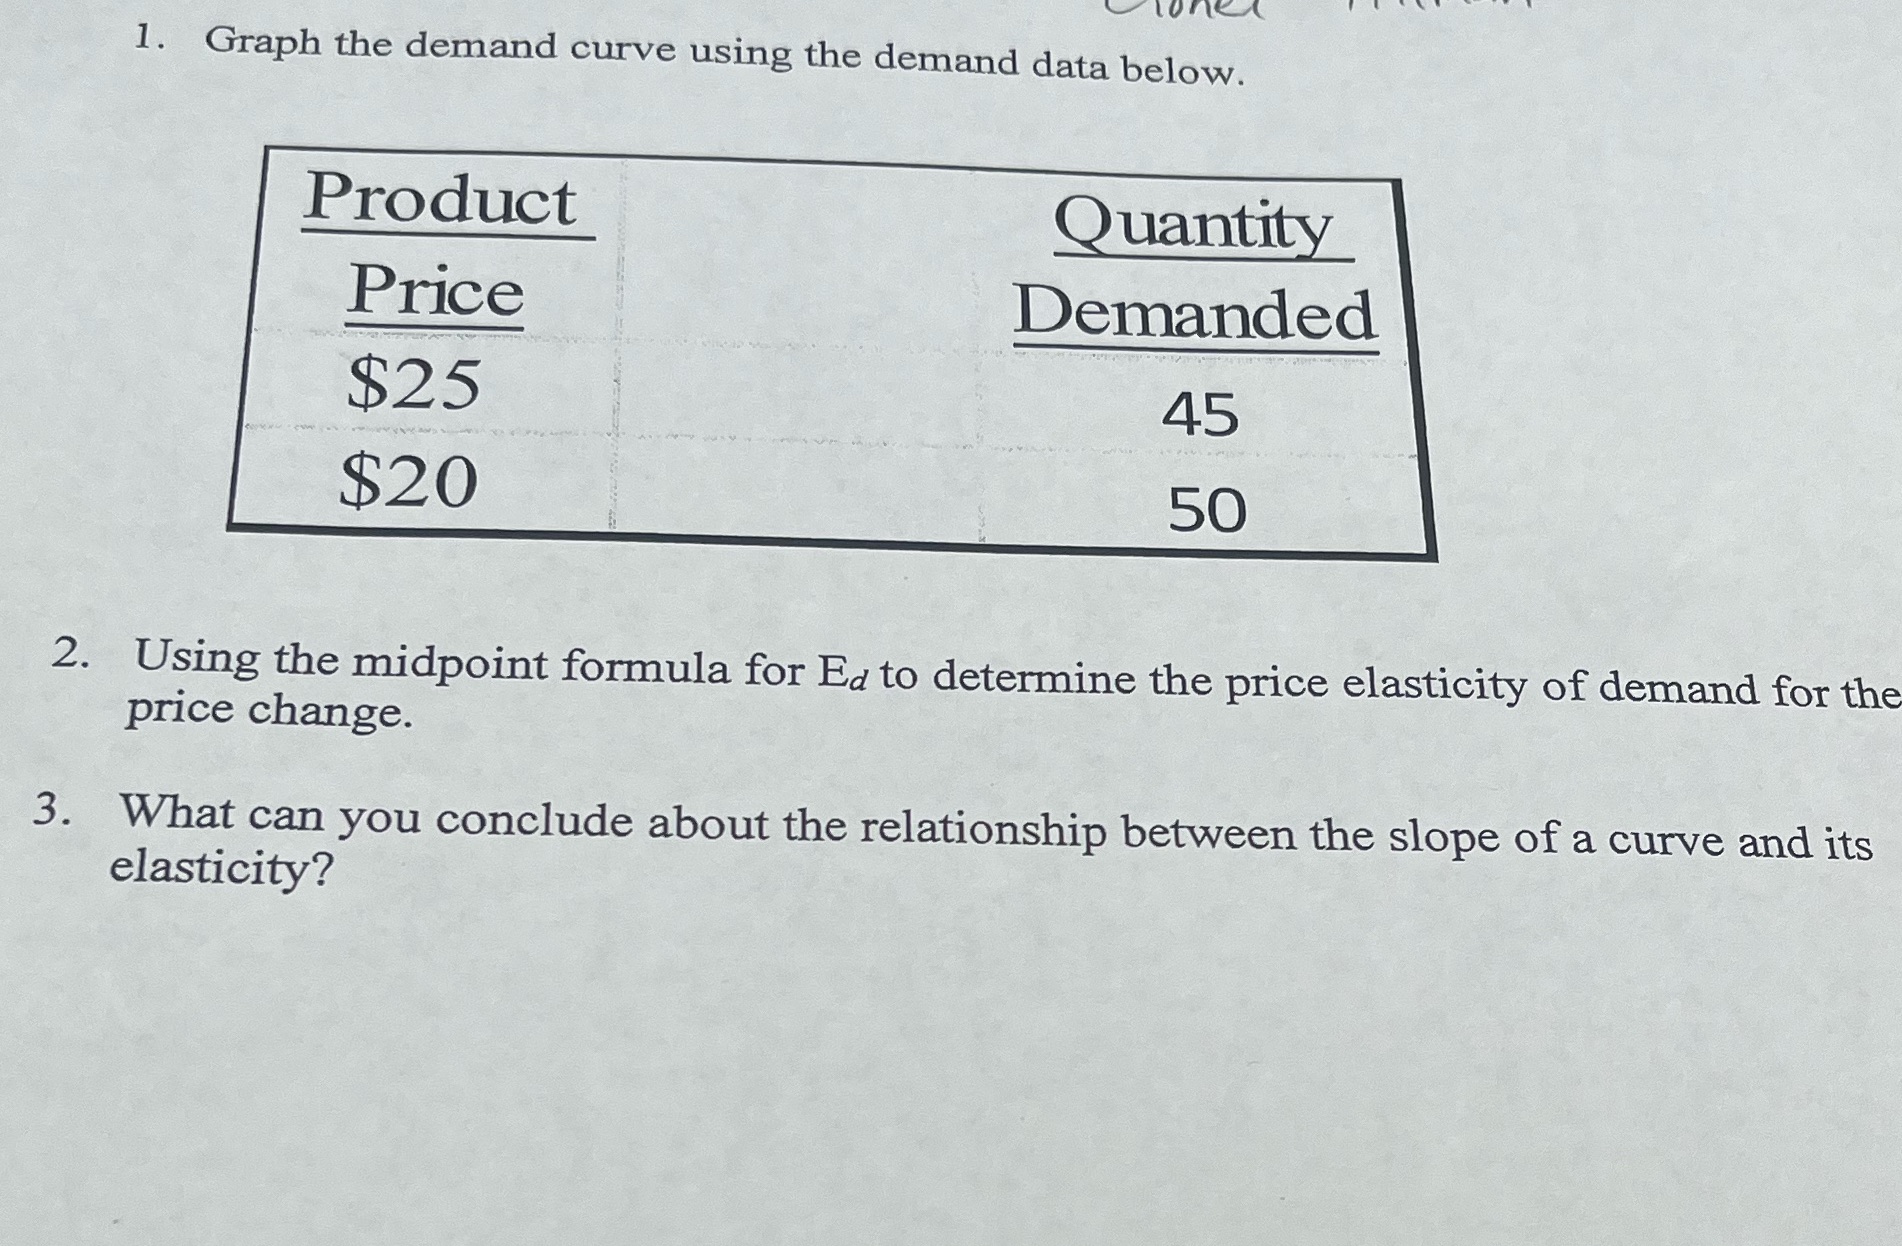
1. Graph the demand curve using the demand data below. Product Quantity Price Demanded $25 45 $20 50 2. Using the midpoint formula for Ed to determine the price elasticity of demand for the price change. 3. What can you conclude about the relationship between the slope of a curve and its elasticity
Step by Step Solution
There are 3 Steps involved in it
1 Expert Approved Answer
Step: 1 Unlock

Question Has Been Solved by an Expert!
Get step-by-step solutions from verified subject matter experts
Step: 2 Unlock
Step: 3 Unlock