

Question: 1. How to calculate WACC ? - Show clear calculation and explain. - Where to take figures from the exhibits given. Case 33 California Pista
1. How to calculate WACC ?
- Show clear calculation and explain.
- Where to take figures from the exhibits given.
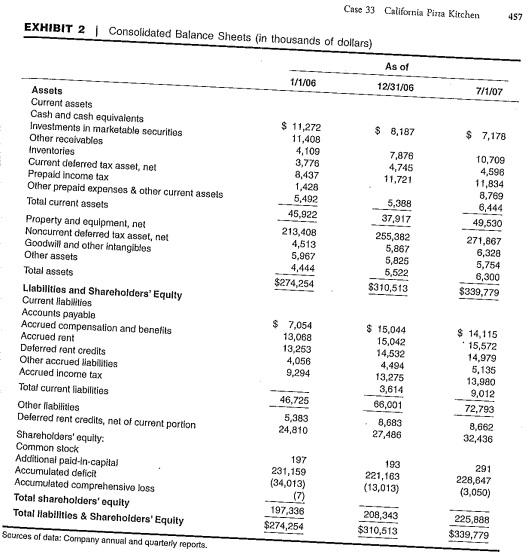
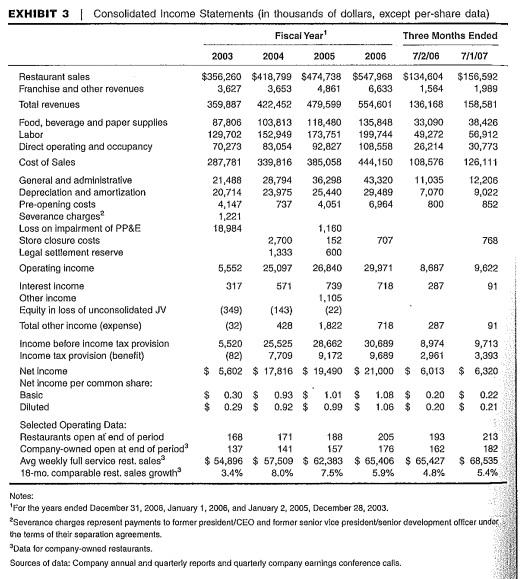
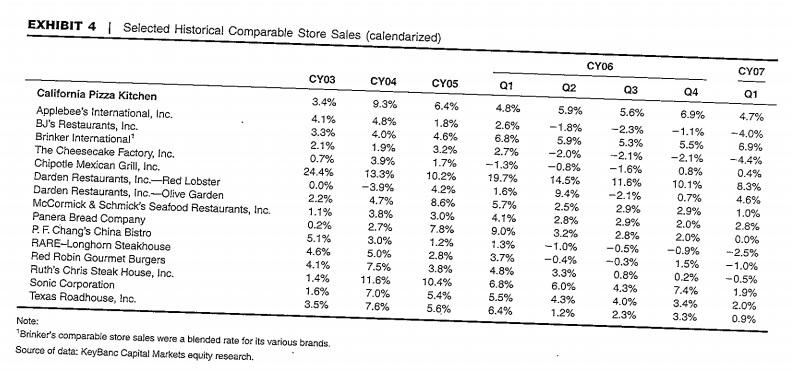
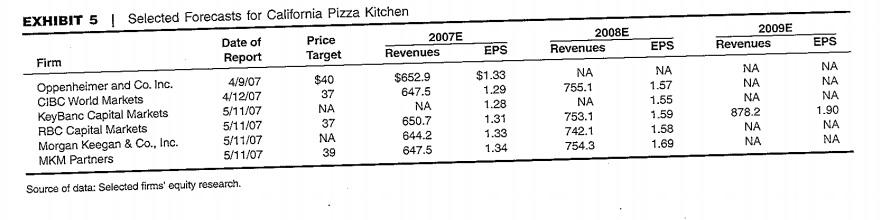
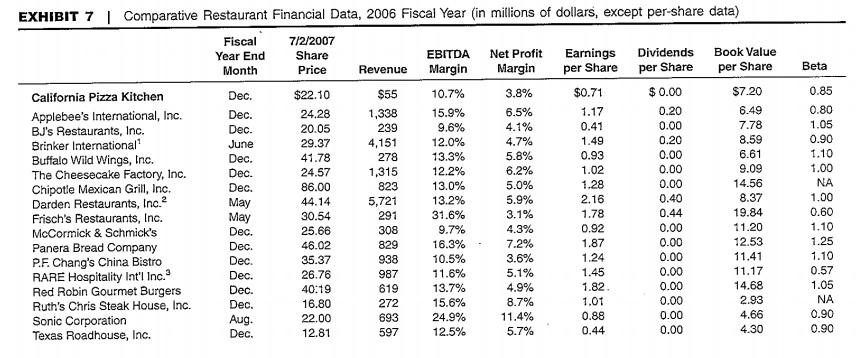
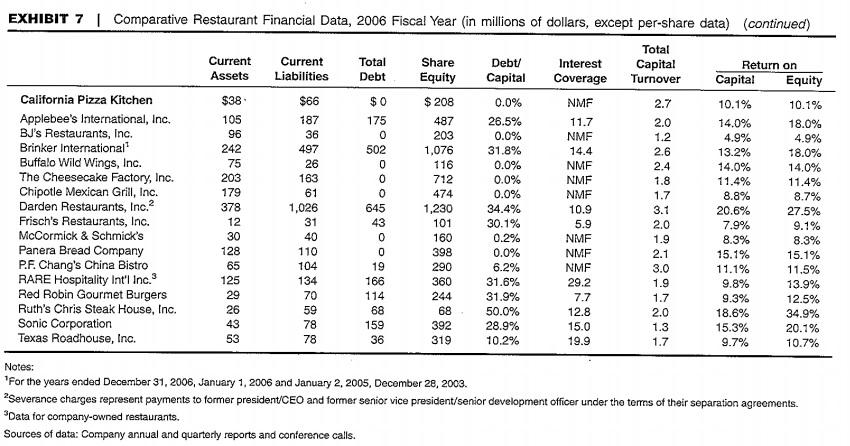
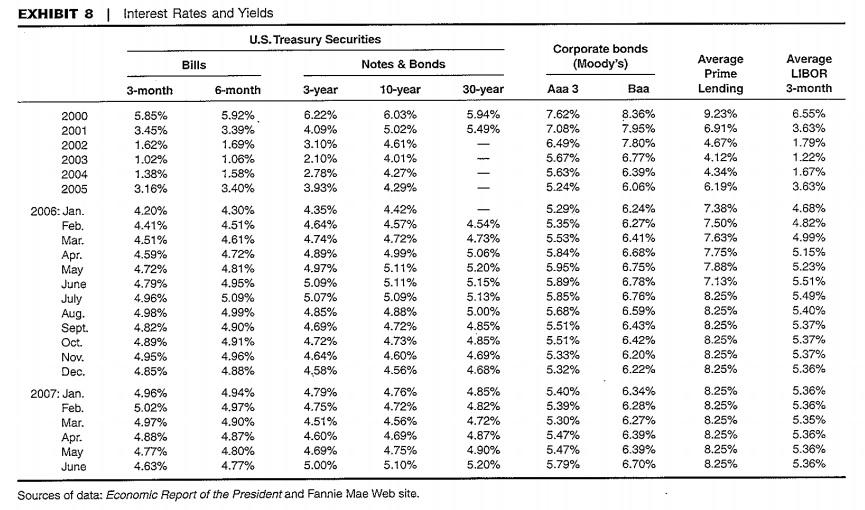
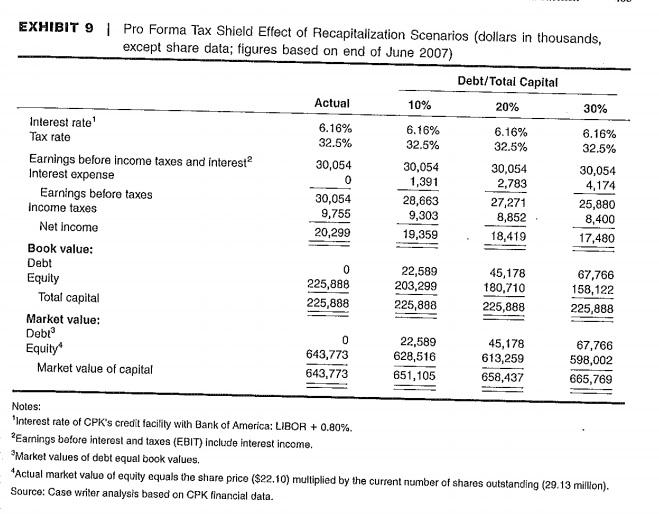
Case 33 California Pista Kitchen 457 EXHIBIT 2 Consolidated Balance Sheets (in thousands of dollars) As of 1/1/06 12/31/06 7/1/07 $ 8.187 $ 7,178 7,876 4,745 11,721 $ 11,272 11,408 4,109 3,776 8,437 1,428 5,492 45,922 213,408 4,513 5,867 5,388 37,917 255,382 5,867 5,825 5,522 $310,513 10,709 4,596 11,834 8,769 6,444 49,530 271,867 6,328 5,754 6,300 $339,779 $274,254 Assets Current assets Cash and cash equivalents Investments in marketable securities Other receivables Inventories Current deferred tax asset, net Propaid income tax Other prepaid expenses & other current assets Total current assets Property and equipment, net Noncurrent deferred tax asset, net Goodwill and other intangibles Other assets Total assets Llabilities and Shareholders' Equity Current abilities Accounts payable Accrued compensation and benefits Accrued rent Deferred rent credits Other accrued liabilities Accrued income tax Total current liabilities Other liabilities Deferred ront credits, net of current portion Shareholders' equity. Common stock Additional pald-In-capital Accumulated delicit Accumulated comprehensive loss Total shareholders' equity Total Habilities & Shareholders' Equity $ 7,054 13,068 13,253 4,056 9,294 $ 15,044 15,042 14,532 4,494 13,275 3,614 66,001 8,683 27,486 $ 14,115 15,572 14,979 5,135 13,980 9,012 72,793 46,725 5,383 24,810 8,662 32,436 197 231, 159 (34,013) (7) 197,336 $274,254 193 221,163 (13,013) 291 228,647 (3,050) 208,343 $310,513 225,888 $339,779 Sources of data: Company annual and quarterly reports. 1.221 EXHIBIT 3 | Consolidated Income Statements in thousands of dollars, except per-share data) Fiscal Year Three Months Ended 2003 2004 2005 2006 7/2/06 7/1/07 Restaurant sales $356,260 $418,799 $474,738 $547,969 $134,604 $156,592 Franchise and other revenues 3,627 3,653 4,861 6,633 1,564 1,989 Total revenues 369,887 422,452 479,599 554,601 136,168 158,581 Food, beverage and paper supplies 87,806 103,813 118,480 135,848 33,090 38,426 Labor 129,702 152,949 173,751 199,744 49,272 56,912 Direct operating and occupancy 70,273 83,054 92,827 108,558 28,214 30,773 Cost of Sales 287,781 339,816 385,058 444,150 108,576 126,111 Goneral and administrative 21,488 28,794 36,298 43,320 11,035 12,206 Depreciation and amortization 20,714 23,975 25,440 29,489 7,070 9,022 Pre-opening costs 4,147 737 4,051 6,964 800 852 Soverance charges Loss on impairment of PP&E 18,984 1,160 Store closure costs 2,700 152 707 768 Legal settlement reserve 1,333 600 Operating income 5,552 25,097 26,840 29.971 8,687 9,622 Interest Income 317 571 739 718 287 91 Other income 1.105 Equity in loss of unconsolidated JV (349) (143) (22) Total other income (expense) (32) 428 1,822 718 287 91 Income before income tax provision 5,520 25,525 28,662 30,689 8,974 9,713 Income tax provision (bonefit) (82) 7.709 9,172 9,689 2,961 3,393 Net Income $ 5,602 $ 17,816 $ 19,490 $ 21,000 $ 6,013 $ 6,320 Net Income per common share: Basic $ 0.30 $ 0.93 $ 1.01 $ 1.08 $ 0.20 $ 0.22 Diluted $ 0.29 $ 0.92 $ 0.99 $ 1.06 $ $ 0.21 Selected Operating Data: Restaurants open at end of period 168 171 188 205 193 213 Company-owned open at end of period 137 141 157 176 162 182 Avg weekly full service rest. sales $ 54,896 $ 57,509 $ 62,383 $ 65,406 $ 65,427 $ 68,535 18-mo.comparable rest. sales growth 8.0% 7.5% 5.9% 4.8% 5.4% 0.20 WAKA 3.4% Notes: 'For the years ended December 31, 2006, January 1, 2005, and January 2, 2005, December 28, 2003. Severance charges represent payments to former president/CEO and former senior vice president/senior development officer under the terms of their separation agreements Data for company-owned restaurants. Sources of data: Company annual and quarterly reports and quarterly company earnings conference calls. EXHIBIT 4 | Selected Historical Comparable Store Sales (calendarized) CY06 CY07 CY03 CY04 CY05 Q1 Q2 Q3 Q4 Q1 3.4% 6.9% California Pizza Kitchen Applebee's International, Inc. BJ's Restaurants, Inc. Brinker International The Cheesecake Factory, Inc. Chipotle Mexican Grill, Inc. Darden Restaurants, Inc.-Red Lobster Darden Restaurants, Inc.-Olive Garden McCormick & Schmick's Seafood Restaurants, Inc. Panera Bread Company P. F. Chang's China Bistro RARE-Longhorn Steakhouse Red Robin Gourmet Burgers Ruth's Chris Steak House, Inc. Sonic Corporation Texas Roadhouse, Inc. 4.1% 3.3% 2.1% 0.7% 24.4% 0.0% 2.2% 1.1% 0.2% 5.1% 4.6% 4.1% 1.4% 1.6% 3.5% 9.3% 4.8% 4.0% 1.9% 3.9% 13.3% -3.9% 4.7% 3.8% 2.7% 3.0% 5.0% 7.5% 11.6% 7.0% 7.6% 6.4% 1.8% 4.6% 3.2% 1.7% 10.2% 4.2% 8.6% 3.0% 7.8% 1.2% 2.8% 3.8% 10.4% 5.4% 4.8% 2.6% 6.8% 2.7% -1.3% 19.7% 1.6% 5.7% 4.1% 9.0% 1.3% 3.7% 4.8% 6.8% 5.5% 6.4% 5.9% -1.8% 5.9% -2.0% -0.8% 14.5% 9.4% 2.5% 2.8% 3.2% -1.0% -0.4% 3.3% 6.0% 4.3% 1.2% 5.6% -2.3% 5.3% -2.1% -1.6% 11.6% -2.1% 2.9% 2.9% 2.8% -0.5% -0.3% 0.8% 4.3% 4.0% 2.3% -1.1% 5.5% -2.1% 0.8% 10.1% 0.7% 2.9% 2.0% 2.0% -0.9% 1.5% 0.2% 7.4% 3.4% 3.3% 4.7% -4.0% 6.9% -4.4% 0.4% 8.3% 4.6% 1.0% 2.8% 0.0% -2.5% -1.0% -0.5% 1.9% 2.0% 0.9% 5.6% Note: Brinker's comparable store sales were a blended rate for its various brands. Source of data: KeyBanc Capital Markets equity research. 2008E Revenues 2009E Revenues EPS EPS EPS NA NA EXHIBIT 5 | Selected Forecasts for California Pizza Kitchen Date of Price 2007E Firm Report Target Revenues Oppenheimer and Co. Inc. 4/9/07 $40 $652.9 CIBC World Markets 4/12/07 37 647.5 KeyBanc Capital Markets 5/11/07 NA NA RBC Capital Markets 5/11/07 37 650.7 Morgan Keegan & Co., Inc. 5/11/07 NA 644.2 MKM Partners 5/11/07 39 647.5 $1.33 1.29 1.28 1.31 1.33 1.34 NA 755.1 NA 753.1 742.1 754.3 NA 1.57 1.55 1.59 1.58 1.69 NA NA NA 878.2 NA NA NA 1.90 NA NA Source of data: Selected firms' equity research. Beta EXHIBIT 7 | Comparative Restaurant Financial Data, 2006 Fiscal Year (in millions of dollars, except per-share data) Fiscal 7/2/2007 Year End Share EBITDA Net Profit Earnings Dividends Book Value Month Price Revenue Margin Margin per Share per Share per Share California Pizza Kitchen Dec. $22.10 $55 10.7% 3.8% $0.71 $ 0.00 $7.20 Applebee's International, Inc. Dec. 24.28 1,338 15.9% 6.5% 1.17 0.20 6.49 BJ's Restaurants, Inc. Dec. 20.05 239 9.6% 4.1% 0.41 0.00 7.78 Brinker International June 29.37 4,151 12.0% 4.7% 1.49 0.20 8.59 Buffalo Wild Wings, Inc. Dec. 41.78 278 13.3% 5.8% 0.93 0.00 6.61 The Cheesecake Factory, Inc. Dec. 24.57 1,315 12.2% 8.2% 1.02 0.00 9.09 Chipotle Mexican Grill, Inc. Dec. 86.00 823 13.0% 5.0% 1.28 0.00 14.56 Darden Restaurants, Inc. May 44.14 5,721 13.2% 5.9% 2.16 0.40 8.37 Frisch's Restaurants, Inc. May 30.54 291 31.6% 3.1% 1.78 0.44 19.84 McCormick & Schmick's Dec. 25.66 308 9.7% 4.3% 0.92 0.00 11.20 Panera Bread Company Dec. 46.02 829 16.3% 7.2% 1.87 0.00 12.53 P.F. Chang's China Bistro 35.37 938 10.5% 3.6% 1.24 0.00 11.41 RARE Hospitality Int'l Inc. Dec. 26.76 987 11.6% 5.1% 1.45 0.00 11.17 Red Robin Gourmet Burgers Dec. 40:19 619 13.7% 4.9% 1.82 0.00 14.68 Ruth's Chris Steak House, Inc. Dec. 16.80 272 15.6% 8.7% 1.01 0.00 2.93 Sonic Corporation Aug. 22.00 693 24.9% 11.4% 0.88 0.00 4.66 Texas Roadhouse, Inc. Dec. 12.81 597 12.5% 5.7% 0.44 0.00 4.30 0.85 0.80 1.05 0.90 1.10 1.00 NA 1.00 0.60 1.10 1.25 1.10 0.57 1.05 NA 0.90 0.90 Dec EXHIBIT 7 | Comparative Restaurant Financial Data, 2006 Fiscal Year (in millions of dollars, except per-share data) (continued) 187 26 Total Current Current Total Share Debt/ Interest Capital Return on Assets Liabilities Debt Equity Capital Coverage Turnover Capital Equity California Pizza Kitchen $38 $66 $0 $ 208 0.0% NMF 2.7 10.1% 10.1% Applebee's International, Inc. 105 175 487 26.5% 11.7 2.0 14.0% 18.0% BJ's Restaurants, Inc. 96 36 0 203 0.0% NMF 1.2 4.9% 4.9% Brinker International 242 497 502 1,076 31.8% 14.4 2.6 13.2% 18.0% Buffalo Wild Wings, Inc. 75 0 116 0.0% NMF 2.4 14.0% 14.0% The Cheesecake Factory, Inc. 203 163 0 712 0.0% NMF 1.8 11.4% 11.4% Chipotle Mexican Grill, Inc. 179 61 0 474 0.0% NMF 1.7 8.8% 8.7% Darden Restaurants, Inc.? 378 1,026 645 1,230 34.4% 10.9 3.1 20.6% 27.5% Frisch's Restaurants, Inc. 12 31 43 101 30.1% 5.9 2.0 7.9% 9.1% McCormick & Schmick's 30 40 0 160 0.2% NMF 1.9 8.3% 8.3% Panera Bread Company 128 110 0 398 0.0% NMF 2.1 15.1% 15.1% P.F. Chang's China Bistro 65 104 19 290 6.2% NMF 3.0 11.1% 11.5% RARE Hospitality Int'l Inc. 125 134 166 360 31.6% 29.2 1.9 9.8% 13.9% Red Robin Gourmet Burgers 29 70 114 244 31.9% 7.7 1.7 9.3% 12.5% Ruth's Chris Steak House, Inc. 26 59 68 68 50.0% 12.8 2.0 18.6% 34.9% Sonic Corporation 43 78 159 392 28.9% 15.0 1.3 15.3% 20.1% Texas Roadhouse, Inc. 53 78 36 319 10.2% 19.9 1.7 9.7% 10.7% Notes: 'For the years onded December 31, 2006, January 1, 2006 and January 2, 2005, Decomber 28, 2003. 2Severance charges represent payments to former president/CEO and former senior vice president/senior development officer under the terms of their separation agreements. *Data for company-owned restaurants. Sources of data: Company annual and quarterly reports and conterence calls. EXHIBIT 8 Interest Rates and Yields U.S. Treasury Securities Bills Notes & Bonds 3-month 6-month 3-year 10-year Average Prime Lending Average LIBOR 3-month 30-year 5.94% 5.49% 6.22% 4.09% 3.10% 2.10% 2.78% 3.93% 6.03% 5.02% 4.61% 4.01% 4.27% 4.29% 9.23% 6.91% 4.67% 4.12% 4.34% 6.19% 6.55% 3.63% 1.79% 1.22% 1.67% 3.63% 2000 2001 2002 2003 2004 2005 2006: Jan. Feb. Mar. Apr. May June July Aug. Sept. Oct. Nov. Dec. 2007: Jan. Feb. Mar. Apr. May June 5.85% 3.45% 1.62% 1.02% 1.38% 3.16% 4.20% 4.41% 4.51% 4.59% 4.72% 4.79% 4.96% 4.98% 4.82% 4.89% 4.95% 4.85% 4.96% 5.02% 4.97% 4.88% 4.77% 4.63% 5.92% 3.39% 1.69% 1.06% 1.58% 3.40% 4.30% 4.51% 4.61% 4.72% 4.81% 4.95% 5.09% 4.99% 4.90% 4.91% 4.96% 4.88% 4.35% 4.64% 4.74% 4.89% 4.97% 5.09% 5.07% 4.85% 4.69% 4.72% 4.64% 4,58% 4.79% 4.75% 4.51% 4.60% 4.69% 5.00% 4.42% 4.57% 4.72% 4.99% 5.11% 5.11% 5.09% 4.88% 4.72% 4.73% 4.60% 4.56% Corporate bonds (Moody's) 3 Baa 7.62% 8.36% 7.08% 7.95% 6.49% 7.80% 5.67% 6.77% 5.63% 6.39% 5.24% 6.06% 5.29% 6.24% 5.35% 6.27% 5.53% 6.41% 5.84% 6.68% 5.95% 6.75% 5.89% 6.78% 5.85% 6.76% 5.68% 6.59% 5.51% 6.43% 5.51% 6.42% 5.33% 6.20% 5.32% 6.22% 4.54% 4.73% 5.06% 5.20% 5.15% 5.13% 5.00% 4.85% 4.85% 4.69% 4.68% 7.38% 7.50% 7.63% 7.75% 7.88% 7.13% 8.25% 8.25% 8.25% 8.25% 8.25% 8.25% 4.68% 4.82% 4.99% 5.15% 5.23% 5.51% 5.49% 5.40% 5.37% 5.37% 5.37% 5.36% 4.94% 4.97% 4.90% 4.87% 4.80% 4.77% 4.76% 4.72% 4.56% 4.69% 4.75% 5.10% 4.85% 4.82% 4.72% 4.87% 4.90% 5.20% 5.40% 5.39% 5.30% 5.47% 5.47% 5.79% 6.34% 6.28% 6.27% 6.39% 6.39% 6.70% 8.25% 8.25% 8.25% 8.25% 8.25% 8.25% 5.36% 5.36% 5.35% 5.36% 5.36% 5.36% Sources of data: Economic Report of the President and Fannie Mae Web site. EXHIBIT 9 Pro Forma Tax Shield Effect of Recapitalization Scenarios (dollars in thousands, except share data; figures based on end of June 2007) Debt/Total Capital Actual 10% 20% 30% Interest rate 6.16% 6.16% 6.16% 6.16% Tax rate 32.5% 32.5% 32.5% 32.5% Earnings before income taxes and interest 30,054 30,054 30,054 30,054 Interest expense 0 1,391 2,783 4,174 Earnings before taxes 30,054 28,663 27,271 25,880 Income taxes 9,755 9,303 8,852 8,400 Net Income 20,299 19,359 18,419 17,480 Book value: Debt 22,589 45,178 67,766 Equity 225,888 203,299 180,710 158,122 Total capital 225,888 225,888 225,888 225,888 Market value: Debl 0 22,589 45,178 67,766 Equity 643,773 628,516 613,259 598,002 Market value of capital 643.773 651,105 658,437 665,769 Notes: Interest rate of CPK's credit facility with Bank of America: LIBOR + 0.80%. Earnings bofore interest and taxes (EBIT) include interest income. *Market values of debt equal book values. Actual market value of equity equals the share price ($22.10) multiplied by the current number of shares outstanding (29.13 million). Source: Case writer analysis based on CPK financial data. Case 33 California Pista Kitchen 457 EXHIBIT 2 Consolidated Balance Sheets (in thousands of dollars) As of 1/1/06 12/31/06 7/1/07 $ 8.187 $ 7,178 7,876 4,745 11,721 $ 11,272 11,408 4,109 3,776 8,437 1,428 5,492 45,922 213,408 4,513 5,867 5,388 37,917 255,382 5,867 5,825 5,522 $310,513 10,709 4,596 11,834 8,769 6,444 49,530 271,867 6,328 5,754 6,300 $339,779 $274,254 Assets Current assets Cash and cash equivalents Investments in marketable securities Other receivables Inventories Current deferred tax asset, net Propaid income tax Other prepaid expenses & other current assets Total current assets Property and equipment, net Noncurrent deferred tax asset, net Goodwill and other intangibles Other assets Total assets Llabilities and Shareholders' Equity Current abilities Accounts payable Accrued compensation and benefits Accrued rent Deferred rent credits Other accrued liabilities Accrued income tax Total current liabilities Other liabilities Deferred ront credits, net of current portion Shareholders' equity. Common stock Additional pald-In-capital Accumulated delicit Accumulated comprehensive loss Total shareholders' equity Total Habilities & Shareholders' Equity $ 7,054 13,068 13,253 4,056 9,294 $ 15,044 15,042 14,532 4,494 13,275 3,614 66,001 8,683 27,486 $ 14,115 15,572 14,979 5,135 13,980 9,012 72,793 46,725 5,383 24,810 8,662 32,436 197 231, 159 (34,013) (7) 197,336 $274,254 193 221,163 (13,013) 291 228,647 (3,050) 208,343 $310,513 225,888 $339,779 Sources of data: Company annual and quarterly reports. 1.221 EXHIBIT 3 | Consolidated Income Statements in thousands of dollars, except per-share data) Fiscal Year Three Months Ended 2003 2004 2005 2006 7/2/06 7/1/07 Restaurant sales $356,260 $418,799 $474,738 $547,969 $134,604 $156,592 Franchise and other revenues 3,627 3,653 4,861 6,633 1,564 1,989 Total revenues 369,887 422,452 479,599 554,601 136,168 158,581 Food, beverage and paper supplies 87,806 103,813 118,480 135,848 33,090 38,426 Labor 129,702 152,949 173,751 199,744 49,272 56,912 Direct operating and occupancy 70,273 83,054 92,827 108,558 28,214 30,773 Cost of Sales 287,781 339,816 385,058 444,150 108,576 126,111 Goneral and administrative 21,488 28,794 36,298 43,320 11,035 12,206 Depreciation and amortization 20,714 23,975 25,440 29,489 7,070 9,022 Pre-opening costs 4,147 737 4,051 6,964 800 852 Soverance charges Loss on impairment of PP&E 18,984 1,160 Store closure costs 2,700 152 707 768 Legal settlement reserve 1,333 600 Operating income 5,552 25,097 26,840 29.971 8,687 9,622 Interest Income 317 571 739 718 287 91 Other income 1.105 Equity in loss of unconsolidated JV (349) (143) (22) Total other income (expense) (32) 428 1,822 718 287 91 Income before income tax provision 5,520 25,525 28,662 30,689 8,974 9,713 Income tax provision (bonefit) (82) 7.709 9,172 9,689 2,961 3,393 Net Income $ 5,602 $ 17,816 $ 19,490 $ 21,000 $ 6,013 $ 6,320 Net Income per common share: Basic $ 0.30 $ 0.93 $ 1.01 $ 1.08 $ 0.20 $ 0.22 Diluted $ 0.29 $ 0.92 $ 0.99 $ 1.06 $ $ 0.21 Selected Operating Data: Restaurants open at end of period 168 171 188 205 193 213 Company-owned open at end of period 137 141 157 176 162 182 Avg weekly full service rest. sales $ 54,896 $ 57,509 $ 62,383 $ 65,406 $ 65,427 $ 68,535 18-mo.comparable rest. sales growth 8.0% 7.5% 5.9% 4.8% 5.4% 0.20 WAKA 3.4% Notes: 'For the years ended December 31, 2006, January 1, 2005, and January 2, 2005, December 28, 2003. Severance charges represent payments to former president/CEO and former senior vice president/senior development officer under the terms of their separation agreements Data for company-owned restaurants. Sources of data: Company annual and quarterly reports and quarterly company earnings conference calls. EXHIBIT 4 | Selected Historical Comparable Store Sales (calendarized) CY06 CY07 CY03 CY04 CY05 Q1 Q2 Q3 Q4 Q1 3.4% 6.9% California Pizza Kitchen Applebee's International, Inc. BJ's Restaurants, Inc. Brinker International The Cheesecake Factory, Inc. Chipotle Mexican Grill, Inc. Darden Restaurants, Inc.-Red Lobster Darden Restaurants, Inc.-Olive Garden McCormick & Schmick's Seafood Restaurants, Inc. Panera Bread Company P. F. Chang's China Bistro RARE-Longhorn Steakhouse Red Robin Gourmet Burgers Ruth's Chris Steak House, Inc. Sonic Corporation Texas Roadhouse, Inc. 4.1% 3.3% 2.1% 0.7% 24.4% 0.0% 2.2% 1.1% 0.2% 5.1% 4.6% 4.1% 1.4% 1.6% 3.5% 9.3% 4.8% 4.0% 1.9% 3.9% 13.3% -3.9% 4.7% 3.8% 2.7% 3.0% 5.0% 7.5% 11.6% 7.0% 7.6% 6.4% 1.8% 4.6% 3.2% 1.7% 10.2% 4.2% 8.6% 3.0% 7.8% 1.2% 2.8% 3.8% 10.4% 5.4% 4.8% 2.6% 6.8% 2.7% -1.3% 19.7% 1.6% 5.7% 4.1% 9.0% 1.3% 3.7% 4.8% 6.8% 5.5% 6.4% 5.9% -1.8% 5.9% -2.0% -0.8% 14.5% 9.4% 2.5% 2.8% 3.2% -1.0% -0.4% 3.3% 6.0% 4.3% 1.2% 5.6% -2.3% 5.3% -2.1% -1.6% 11.6% -2.1% 2.9% 2.9% 2.8% -0.5% -0.3% 0.8% 4.3% 4.0% 2.3% -1.1% 5.5% -2.1% 0.8% 10.1% 0.7% 2.9% 2.0% 2.0% -0.9% 1.5% 0.2% 7.4% 3.4% 3.3% 4.7% -4.0% 6.9% -4.4% 0.4% 8.3% 4.6% 1.0% 2.8% 0.0% -2.5% -1.0% -0.5% 1.9% 2.0% 0.9% 5.6% Note: Brinker's comparable store sales were a blended rate for its various brands. Source of data: KeyBanc Capital Markets equity research. 2008E Revenues 2009E Revenues EPS EPS EPS NA NA EXHIBIT 5 | Selected Forecasts for California Pizza Kitchen Date of Price 2007E Firm Report Target Revenues Oppenheimer and Co. Inc. 4/9/07 $40 $652.9 CIBC World Markets 4/12/07 37 647.5 KeyBanc Capital Markets 5/11/07 NA NA RBC Capital Markets 5/11/07 37 650.7 Morgan Keegan & Co., Inc. 5/11/07 NA 644.2 MKM Partners 5/11/07 39 647.5 $1.33 1.29 1.28 1.31 1.33 1.34 NA 755.1 NA 753.1 742.1 754.3 NA 1.57 1.55 1.59 1.58 1.69 NA NA NA 878.2 NA NA NA 1.90 NA NA Source of data: Selected firms' equity research. Beta EXHIBIT 7 | Comparative Restaurant Financial Data, 2006 Fiscal Year (in millions of dollars, except per-share data) Fiscal 7/2/2007 Year End Share EBITDA Net Profit Earnings Dividends Book Value Month Price Revenue Margin Margin per Share per Share per Share California Pizza Kitchen Dec. $22.10 $55 10.7% 3.8% $0.71 $ 0.00 $7.20 Applebee's International, Inc. Dec. 24.28 1,338 15.9% 6.5% 1.17 0.20 6.49 BJ's Restaurants, Inc. Dec. 20.05 239 9.6% 4.1% 0.41 0.00 7.78 Brinker International June 29.37 4,151 12.0% 4.7% 1.49 0.20 8.59 Buffalo Wild Wings, Inc. Dec. 41.78 278 13.3% 5.8% 0.93 0.00 6.61 The Cheesecake Factory, Inc. Dec. 24.57 1,315 12.2% 8.2% 1.02 0.00 9.09 Chipotle Mexican Grill, Inc. Dec. 86.00 823 13.0% 5.0% 1.28 0.00 14.56 Darden Restaurants, Inc. May 44.14 5,721 13.2% 5.9% 2.16 0.40 8.37 Frisch's Restaurants, Inc. May 30.54 291 31.6% 3.1% 1.78 0.44 19.84 McCormick & Schmick's Dec. 25.66 308 9.7% 4.3% 0.92 0.00 11.20 Panera Bread Company Dec. 46.02 829 16.3% 7.2% 1.87 0.00 12.53 P.F. Chang's China Bistro 35.37 938 10.5% 3.6% 1.24 0.00 11.41 RARE Hospitality Int'l Inc. Dec. 26.76 987 11.6% 5.1% 1.45 0.00 11.17 Red Robin Gourmet Burgers Dec. 40:19 619 13.7% 4.9% 1.82 0.00 14.68 Ruth's Chris Steak House, Inc. Dec. 16.80 272 15.6% 8.7% 1.01 0.00 2.93 Sonic Corporation Aug. 22.00 693 24.9% 11.4% 0.88 0.00 4.66 Texas Roadhouse, Inc. Dec. 12.81 597 12.5% 5.7% 0.44 0.00 4.30 0.85 0.80 1.05 0.90 1.10 1.00 NA 1.00 0.60 1.10 1.25 1.10 0.57 1.05 NA 0.90 0.90 Dec EXHIBIT 7 | Comparative Restaurant Financial Data, 2006 Fiscal Year (in millions of dollars, except per-share data) (continued) 187 26 Total Current Current Total Share Debt/ Interest Capital Return on Assets Liabilities Debt Equity Capital Coverage Turnover Capital Equity California Pizza Kitchen $38 $66 $0 $ 208 0.0% NMF 2.7 10.1% 10.1% Applebee's International, Inc. 105 175 487 26.5% 11.7 2.0 14.0% 18.0% BJ's Restaurants, Inc. 96 36 0 203 0.0% NMF 1.2 4.9% 4.9% Brinker International 242 497 502 1,076 31.8% 14.4 2.6 13.2% 18.0% Buffalo Wild Wings, Inc. 75 0 116 0.0% NMF 2.4 14.0% 14.0% The Cheesecake Factory, Inc. 203 163 0 712 0.0% NMF 1.8 11.4% 11.4% Chipotle Mexican Grill, Inc. 179 61 0 474 0.0% NMF 1.7 8.8% 8.7% Darden Restaurants, Inc.? 378 1,026 645 1,230 34.4% 10.9 3.1 20.6% 27.5% Frisch's Restaurants, Inc. 12 31 43 101 30.1% 5.9 2.0 7.9% 9.1% McCormick & Schmick's 30 40 0 160 0.2% NMF 1.9 8.3% 8.3% Panera Bread Company 128 110 0 398 0.0% NMF 2.1 15.1% 15.1% P.F. Chang's China Bistro 65 104 19 290 6.2% NMF 3.0 11.1% 11.5% RARE Hospitality Int'l Inc. 125 134 166 360 31.6% 29.2 1.9 9.8% 13.9% Red Robin Gourmet Burgers 29 70 114 244 31.9% 7.7 1.7 9.3% 12.5% Ruth's Chris Steak House, Inc. 26 59 68 68 50.0% 12.8 2.0 18.6% 34.9% Sonic Corporation 43 78 159 392 28.9% 15.0 1.3 15.3% 20.1% Texas Roadhouse, Inc. 53 78 36 319 10.2% 19.9 1.7 9.7% 10.7% Notes: 'For the years onded December 31, 2006, January 1, 2006 and January 2, 2005, Decomber 28, 2003. 2Severance charges represent payments to former president/CEO and former senior vice president/senior development officer under the terms of their separation agreements. *Data for company-owned restaurants. Sources of data: Company annual and quarterly reports and conterence calls. EXHIBIT 8 Interest Rates and Yields U.S. Treasury Securities Bills Notes & Bonds 3-month 6-month 3-year 10-year Average Prime Lending Average LIBOR 3-month 30-year 5.94% 5.49% 6.22% 4.09% 3.10% 2.10% 2.78% 3.93% 6.03% 5.02% 4.61% 4.01% 4.27% 4.29% 9.23% 6.91% 4.67% 4.12% 4.34% 6.19% 6.55% 3.63% 1.79% 1.22% 1.67% 3.63% 2000 2001 2002 2003 2004 2005 2006: Jan. Feb. Mar. Apr. May June July Aug. Sept. Oct. Nov. Dec. 2007: Jan. Feb. Mar. Apr. May June 5.85% 3.45% 1.62% 1.02% 1.38% 3.16% 4.20% 4.41% 4.51% 4.59% 4.72% 4.79% 4.96% 4.98% 4.82% 4.89% 4.95% 4.85% 4.96% 5.02% 4.97% 4.88% 4.77% 4.63% 5.92% 3.39% 1.69% 1.06% 1.58% 3.40% 4.30% 4.51% 4.61% 4.72% 4.81% 4.95% 5.09% 4.99% 4.90% 4.91% 4.96% 4.88% 4.35% 4.64% 4.74% 4.89% 4.97% 5.09% 5.07% 4.85% 4.69% 4.72% 4.64% 4,58% 4.79% 4.75% 4.51% 4.60% 4.69% 5.00% 4.42% 4.57% 4.72% 4.99% 5.11% 5.11% 5.09% 4.88% 4.72% 4.73% 4.60% 4.56% Corporate bonds (Moody's) 3 Baa 7.62% 8.36% 7.08% 7.95% 6.49% 7.80% 5.67% 6.77% 5.63% 6.39% 5.24% 6.06% 5.29% 6.24% 5.35% 6.27% 5.53% 6.41% 5.84% 6.68% 5.95% 6.75% 5.89% 6.78% 5.85% 6.76% 5.68% 6.59% 5.51% 6.43% 5.51% 6.42% 5.33% 6.20% 5.32% 6.22% 4.54% 4.73% 5.06% 5.20% 5.15% 5.13% 5.00% 4.85% 4.85% 4.69% 4.68% 7.38% 7.50% 7.63% 7.75% 7.88% 7.13% 8.25% 8.25% 8.25% 8.25% 8.25% 8.25% 4.68% 4.82% 4.99% 5.15% 5.23% 5.51% 5.49% 5.40% 5.37% 5.37% 5.37% 5.36% 4.94% 4.97% 4.90% 4.87% 4.80% 4.77% 4.76% 4.72% 4.56% 4.69% 4.75% 5.10% 4.85% 4.82% 4.72% 4.87% 4.90% 5.20% 5.40% 5.39% 5.30% 5.47% 5.47% 5.79% 6.34% 6.28% 6.27% 6.39% 6.39% 6.70% 8.25% 8.25% 8.25% 8.25% 8.25% 8.25% 5.36% 5.36% 5.35% 5.36% 5.36% 5.36% Sources of data: Economic Report of the President and Fannie Mae Web site. EXHIBIT 9 Pro Forma Tax Shield Effect of Recapitalization Scenarios (dollars in thousands, except share data; figures based on end of June 2007) Debt/Total Capital Actual 10% 20% 30% Interest rate 6.16% 6.16% 6.16% 6.16% Tax rate 32.5% 32.5% 32.5% 32.5% Earnings before income taxes and interest 30,054 30,054 30,054 30,054 Interest expense 0 1,391 2,783 4,174 Earnings before taxes 30,054 28,663 27,271 25,880 Income taxes 9,755 9,303 8,852 8,400 Net Income 20,299 19,359 18,419 17,480 Book value: Debt 22,589 45,178 67,766 Equity 225,888 203,299 180,710 158,122 Total capital 225,888 225,888 225,888 225,888 Market value: Debl 0 22,589 45,178 67,766 Equity 643,773 628,516 613,259 598,002 Market value of capital 643.773 651,105 658,437 665,769 Notes: Interest rate of CPK's credit facility with Bank of America: LIBOR + 0.80%. Earnings bofore interest and taxes (EBIT) include interest income. *Market values of debt equal book values. Actual market value of equity equals the share price ($22.10) multiplied by the current number of shares outstanding (29.13 million). Source: Case writer analysis based on CPK financial data
Step by Step Solution
There are 3 Steps involved in it

Get step-by-step solutions from verified subject matter experts