

Question: 1. How would you go about creating a management dashboard utilizing this data set? Describe your rationale for what key metrics you would pick for
 1. How would you go about creating a management dashboard utilizing this data set? Describe your rationale for what key metrics you would pick for a one-page management dashboard.
2. Present draft of what such dashboard could look like A simple draft is fine.
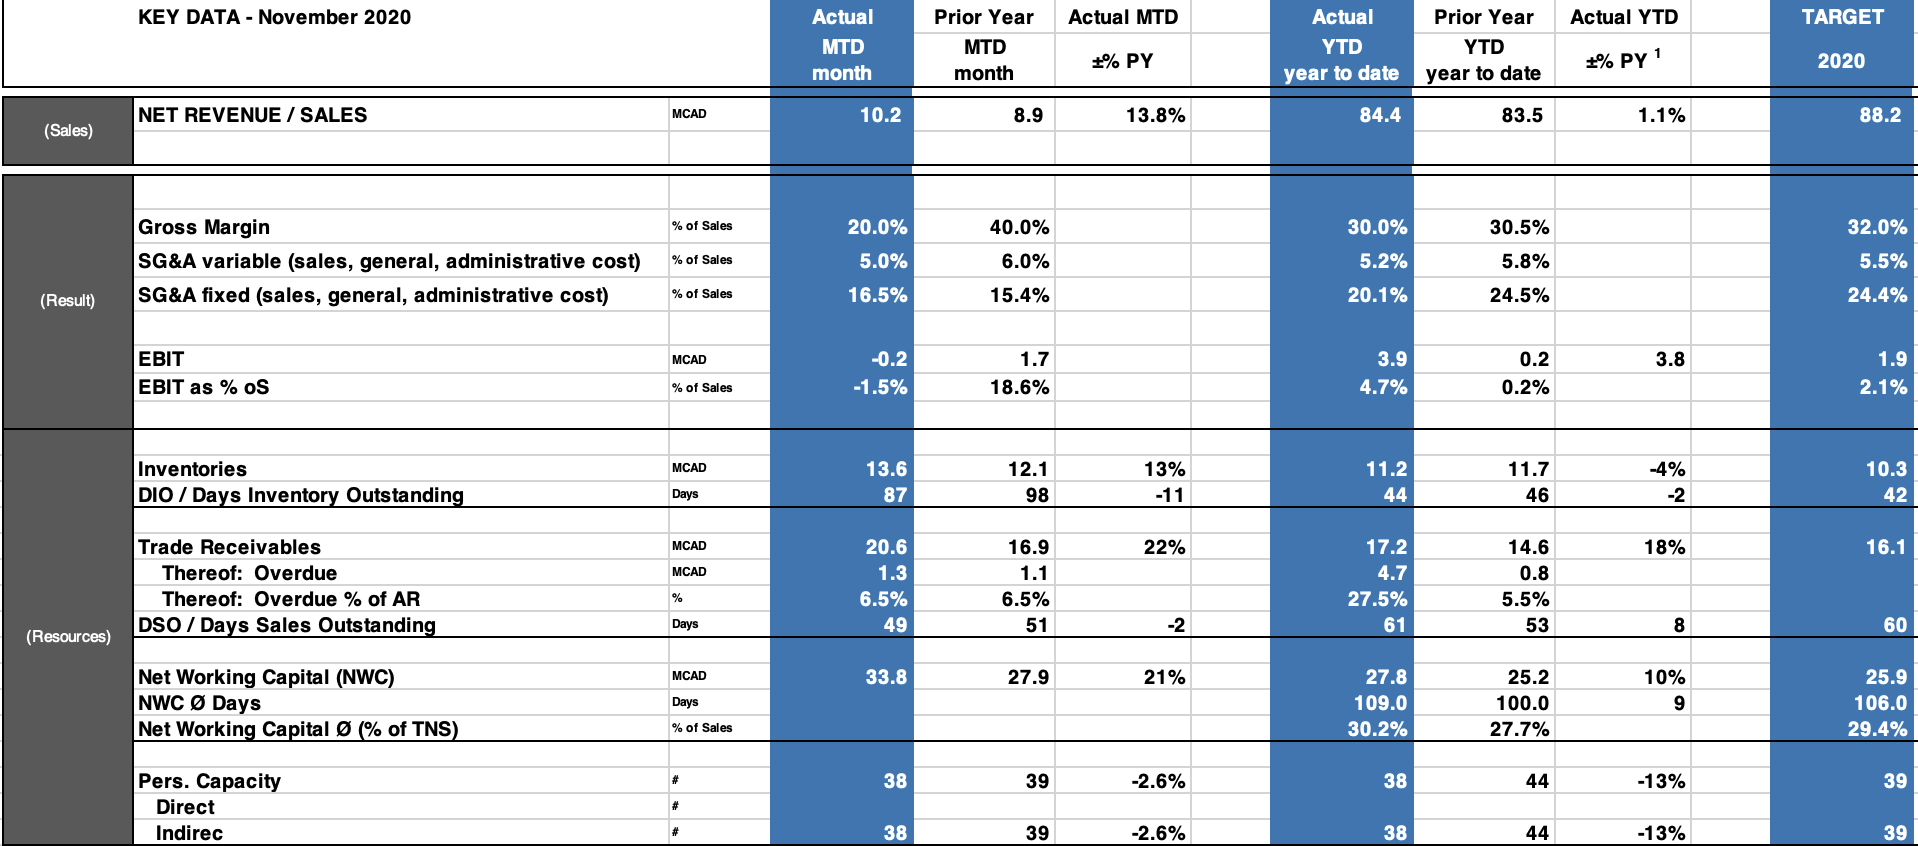
KEY DATA - November 2020 Actual MTD Actual YTD TARGET Actual MTD month Prior Year MTD month Actual YTD year to date Prior Year YTD year to date 1 +% PY +% PY 2020 NET REVENUE / SALES MCAD 10.2 8.9 13.8% 84.4 83.5 1.1% 88.2 (Sales) % of Sales 20.0% 40.0% 30.0% 30.5% 32.0% Gross Margin SG&A variable (sales, general, administrative cost) SG&A fixed (sales, general, administrative cost) % of Sales 5.0% 6.0% 5.2% 5.8% 5.5% (Result) % of Sales 16.5% 15.4% 20.1% 24.5% 24.4% MCAD 3.8 EBIT EBIT as % OS -0.2 -1.5% 1.7 18.6% 3.9 4.7% 0.2 0.2% 1.9 2.1% % of Sales MCAD Inventories DIO / Days Inventory Outstanding 13.6 87 12.1 98 13% -11 11.2 44 11.7 46 -4% -2 10.3 42 Days MCAD 22% 18% 16.1 MCAD Trade Receivables Thereof: Overdue Thereof: Overdue % of AR DSO / Days Sales Outstanding 20.6 1.3 6.5% 49 16.9 1.1 6.5% 51 17.2 4.7 27.5% 61 14.6 0.8 5.5% 53 % Days -2 8 60 (Resources) MCAD 33.8 27.9 21% Net Working Capital (NWC) NWC Days Net Working Capital (% of TNS) 27.8 109.0 30.2% Days 25.2 100.0 27.7% 10% 9 25.9 106.0 29.4% % of Sales 38 39 -2.6% 38 44 -13% 39 Pers. Capacity Direct Indirec # # # 38 39 -2.6% 38 44 -13% 39 KEY DATA - November 2020 Actual MTD Actual YTD TARGET Actual MTD month Prior Year MTD month Actual YTD year to date Prior Year YTD year to date 1 +% PY +% PY 2020 NET REVENUE / SALES MCAD 10.2 8.9 13.8% 84.4 83.5 1.1% 88.2 (Sales) % of Sales 20.0% 40.0% 30.0% 30.5% 32.0% Gross Margin SG&A variable (sales, general, administrative cost) SG&A fixed (sales, general, administrative cost) % of Sales 5.0% 6.0% 5.2% 5.8% 5.5% (Result) % of Sales 16.5% 15.4% 20.1% 24.5% 24.4% MCAD 3.8 EBIT EBIT as % OS -0.2 -1.5% 1.7 18.6% 3.9 4.7% 0.2 0.2% 1.9 2.1% % of Sales MCAD Inventories DIO / Days Inventory Outstanding 13.6 87 12.1 98 13% -11 11.2 44 11.7 46 -4% -2 10.3 42 Days MCAD 22% 18% 16.1 MCAD Trade Receivables Thereof: Overdue Thereof: Overdue % of AR DSO / Days Sales Outstanding 20.6 1.3 6.5% 49 16.9 1.1 6.5% 51 17.2 4.7 27.5% 61 14.6 0.8 5.5% 53 % Days -2 8 60 (Resources) MCAD 33.8 27.9 21% Net Working Capital (NWC) NWC Days Net Working Capital (% of TNS) 27.8 109.0 30.2% Days 25.2 100.0 27.7% 10% 9 25.9 106.0 29.4% % of Sales 38 39 -2.6% 38 44 -13% 39 Pers. Capacity Direct Indirec # # # 38 39 -2.6% 38 44 -13% 39
Step by Step Solution
There are 3 Steps involved in it

Get step-by-step solutions from verified subject matter experts