

1. If there are some major recent events that affect your chosen industry, provide brief updates on...
Question:
1. If there are some major recent events that affect your chosen industry, provide brief updates on the macroeconomic and industry sections of your report. 2. For the stocks you chose in the previous assignment, compute their annual nominal (holding period) rates of return for about 10 years (approximately one business cycle) using the HPR formula. For data, you can go to http://finance.yahoo.com for U.S.-listed stocks or https://ca.finance.yahoo.com/ for stocks listed on TSX. Enter a ticker. Click on Historical Prices and then enter Start and End Date as well as the frequency of the data (monthly). Click Download to Spreadsheet below the data table to download the data in Excel format. You can compute the monthly HPR by using one of the following two methods: a. Use data on either Open or Close price consistently as well as data on dividend disbursements to obtain the HPR.
b. Alternatively, use the Adj Close (adjusted close) price and compute the HPR as a percentage change in the adjusted close price. The adjusted close price has been adjusted for dividends. It is typical to annualize the monthly rates of returns using compound interest, that is,
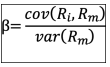
rA = (1+ rm) 12 - 1 where rm is the average monthly rate of return and rA is the annualized return. 3. Using annual data, compute the arithmetic average (nominal) rate of return over the 10-year period and its standard deviation for each stock. If you use Excel for your computations, you can use the built-in functions AVERAGE and STDEV. 4. For each stock, compute the geometric average (nominal) rate of return over the 10-year period. How does it compare to the arithmetic average? In Excel, use GEOMEAN. 5. Compute the (arithmetic) average annual nominal rates of return on a benchmark industry or market index over the chosen period. Compute the (arithmetic) average rate of return over the period and its standard deviation. 6. Compute the real rate of return on the chosen stocks and benchmark index. 7. Compute the excess return on your chosen stocks and benchmark index (if different from the market index). 8. Using annual data on nominal returns, compute the CAPM beta of the stocks. If Ri denotes the rate of return on your chosen stock and Rm the rate of return on the industry/market index, then the CAPM beta of your stock is given by:
Expert Answer:


Auditing Cases An Interactive Learning Approach
ISBN: 978-0132423502
4th Edition
Authors: Steven M Glover, Douglas F Prawitt
