

Question: 1 import matplotlib.pyplot as plt 2 import numpy as np 4 def mean(1st): 5 #TODO: Implement function 6 return 1 7 8 def sd(xlst): 9
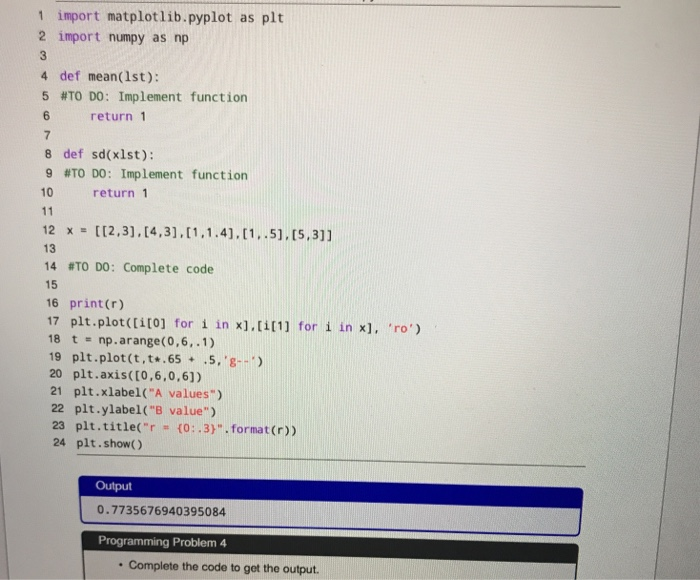
1 import matplotlib.pyplot as plt 2 import numpy as np 4 def mean(1st): 5 #TODO: Implement function 6 return 1 7 8 def sd(xlst): 9 #TODO: Implement function 10 return1 12 [12,3].14,3].11,1.4.1..51,ts.311 13 14 #TODO: Complete code 15 16 print (r) 17 plt.plotctito] for i in x).titt] for i in x], 'ro) 18 t np.arange(0,6,.1) 19 plt.plot (t,t.65.5, 8--) 20 plt.axis((o,6,0,6]) 21 plt.xlabel("A values") 22 plt.ylabel (" value") 23 plt.title(" to:.3)".format (r)) 24 plt.show Output 0.7735676940395084 Programming Problem 4 Complete the code to get the output
Step by Step Solution
There are 3 Steps involved in it
1 Expert Approved Answer
Step: 1 Unlock

Question Has Been Solved by an Expert!
Get step-by-step solutions from verified subject matter experts
Step: 2 Unlock
Step: 3 Unlock