

Question: Problem 5: Correlation Many of us are interested in determining whether one thing is related to another functionally. In particular, assume you have the
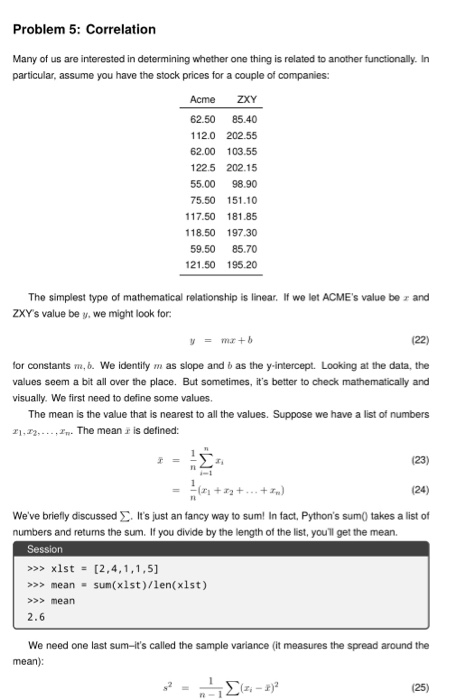
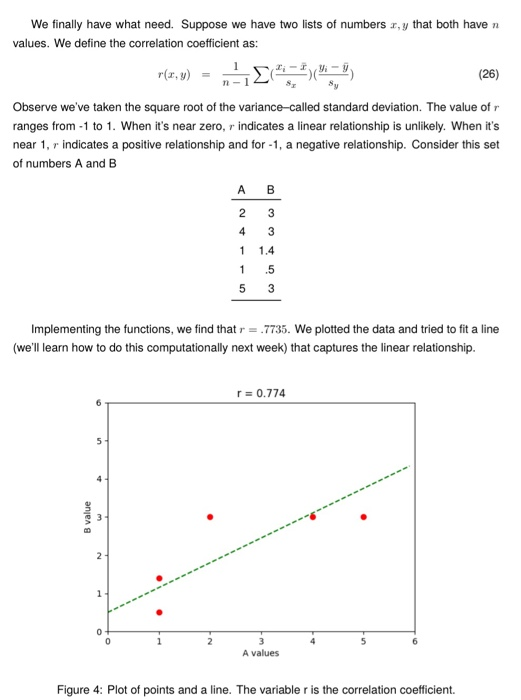
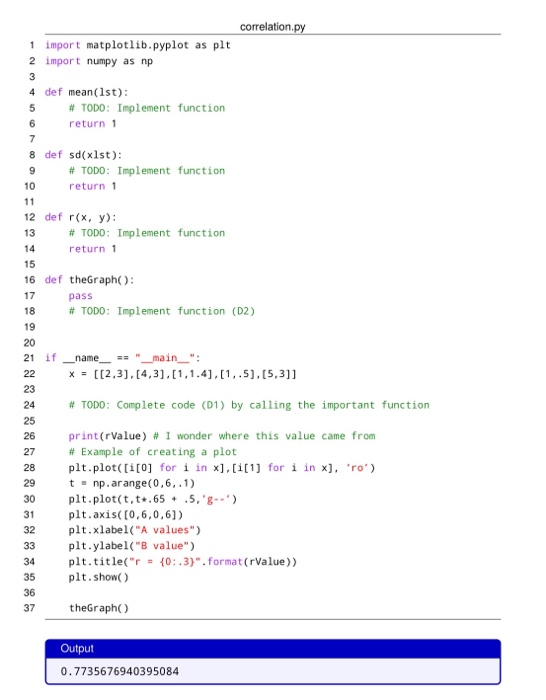
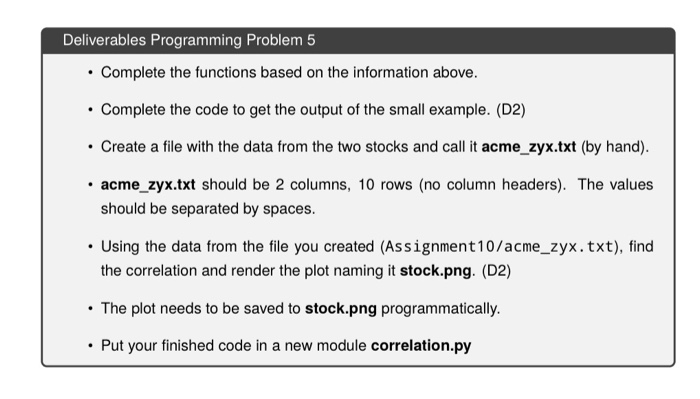
Problem 5: Correlation Many of us are interested in determining whether one thing is related to another functionally. In particular, assume you have the stock prices for a couple of companies: Acme ZXY 62.50 85.40 112.0 202.55 62.00 103.55 122.5 202.15 55.00 98.90 75.50 151.10 117.50 181.85 118.50 197.30 59.50 85.70 121.50 195.20 The simplest type of mathematical relationship is linear. If we let ACME's value bez and ZXY's value be y, we might look for: y = mx + b (22) for constants m, b. We identify mas slope and as the y-intercept. Looking at the data, the values seem a bit all over the place. But sometimes, it's better to check mathematically and visually. We first need to define some values. The mean is the value that is nearest to all the values. Suppose we have a list of numbers 21,22,... The mean is defined: EM- 2 (23) +2+...+2) (24) We've briefly discussed. It's just an fancy way to sum! In fact, Python's sum() takes a list of numbers and returns the sum. If you divide by the length of the list, you'll get the mean. Session >>> x1st = [2,4,1,1,5] >>> mean = sum(x1st)/len(x1st) >>> mean 2.6 We need one last sum-it's called the sample variance (it measures the spread around the mean): (2-2) (25) We finally have what need. Suppose we have two lists of numbers x,y that both have n values. We define the correlation coefficient as: r(x,y) (4) (26) Observe we've taken the square root of the variance-called standard deviation. The value of r ranges from 1 to 1. When it's near zero, r indicates a linear relationship is unlikely. When it's near 1, r indicates a positive relationship and for -1, a negative relationship. Consider this set of numbers A and B B value 5 Implementing the functions, we find that r = .7735. We plotted the data and tried to fit a line (we'll learn how to do this computationally next week) that captures the linear relationship. at m 2 A 2 4 1 1 1 5 B 3 3 1.4 .5 3 r=0.774 3 A values 6 Figure 4: Plot of points and a line. The variable r is the correlation coefficient. 1 import matplotlib.pyplot as plt 2 import numpy as np 3 4 def mean(1st): 5 6 7 8 def sd(xlst): 9 10 #TODO: Implement function return 1 11 12 def r(x, y): 13 27 28 # TODO: Implement function return 1 14 15 16 def theGraph(): 17 18 19 20 21 if _name == "__main__": 22 23 24 25 26 32 33 34 35 36 37 # TODO: Implement function return 1 pass # TODO: Implement function (D2) 29 30 plt.plot(t, t.65.5,'g') 31 plt.axis([0,6,0,61) x= [[2,3], [4,3],[1,1.4],[1,.5], [5,3]] # TODO: Complete code (D1) by calling the important function print (rValue) # I wonder where this value came from # Example of creating a plot plt.plot([i[0] for i in x], [i[1] for i in x], 'ro') t = np.arange(0,6,.1) correlation.py plt.xlabel("A values") plt.ylabel("B value") plt.title("r= (0:.3)". format (rValue)) plt.show() the Graph() Output 0.7735676940395084 Deliverables Programming Problem 5 Complete the functions based on the information above. Complete the code to get the output of the small example. (D2) Create a file with the data from the two stocks and call it acme_zyx.txt (by hand). acme_zyx.txt should be 2 columns, 10 rows (no column headers). The values should be separated by spaces. Using the data from the file you created (Assignment10/acme_zyx.txt), find the correlation and render the plot naming it stock.png. (D2) The plot needs to be saved to stock.png programmatically. Put your finished code in a new module correlation.py
Step by Step Solution
3.37 Rating (156 Votes )
There are 3 Steps involved in it
To complete the assignment follow these steps Step 1 Implement the Functions Implement meanlst This ... View full answer

Get step-by-step solutions from verified subject matter experts