

Question: 1. In the graph below, X and Y represent A. U.S. stocks (X) and international stocks (Y) B. U.S. stocks (Y) and international stocks (X)
1. In the graph below, X and Y represent 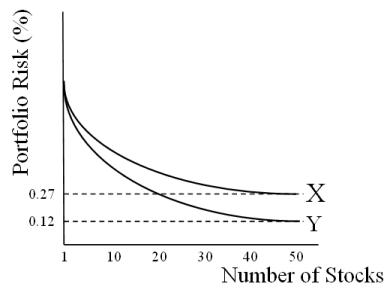
A. U.S. stocks (X) and international stocks (Y) B. U.S. stocks (Y) and international stocks (X) C. systematic risk (X) and unsystematic risk (Y) D. systematic risk (Y) and unsystematic risk (X)
E. none of the above
Portfolio Risk (0) 0.27 X 0.12 -Y 1 10 20 30 40 50 Number of Stocks
Step by Step Solution
There are 3 Steps involved in it
1 Expert Approved Answer
Step: 1 Unlock

Question Has Been Solved by an Expert!
Get step-by-step solutions from verified subject matter experts
Step: 2 Unlock
Step: 3 Unlock