

1. Is at least one of the two variables (weight and horsepower) significant in the model?...
Fantastic news! We've Found the answer you've been seeking!
Question:
Transcribed Image Text:
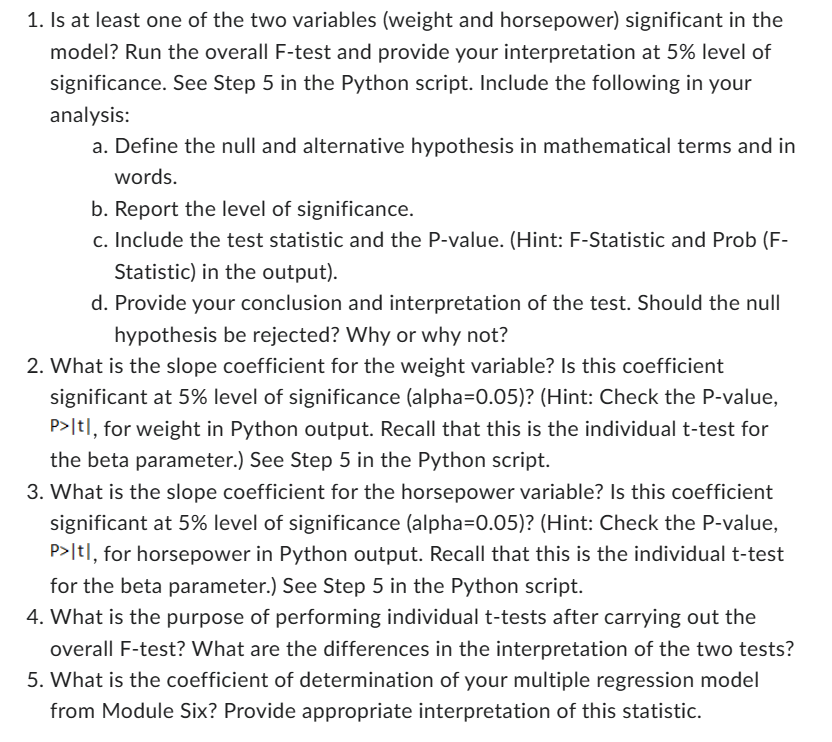
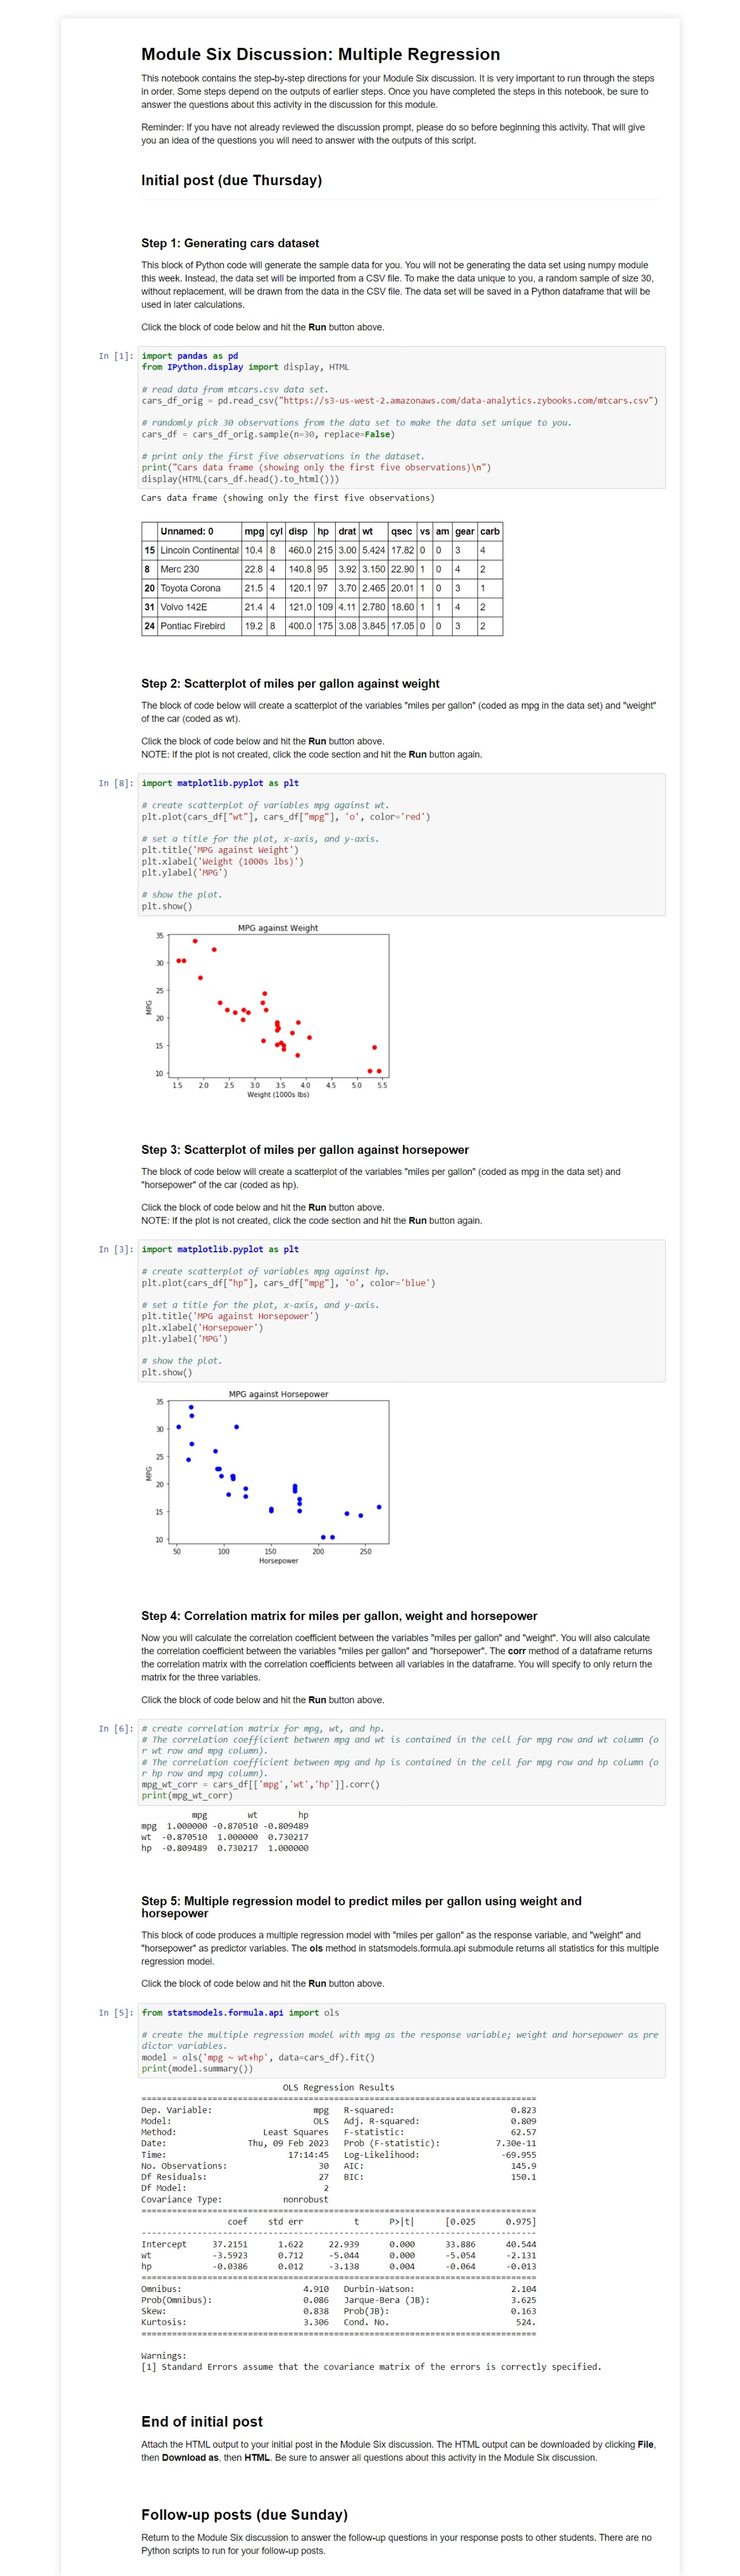
1. Is at least one of the two variables (weight and horsepower) significant in the model? Run the overall F-test and provide your interpretation at 5% level of significance. See Step 5 in the Python script. Include the following in your analysis: a. Define the null and alternative hypothesis in mathematical terms and in words. b. Report the level of significance. c. Include the test statistic and the P-value. (Hint: F-Statistic and Prob (F- Statistic) in the output). d. Provide your conclusion and interpretation of the test. Should the null hypothesis be rejected? Why or why not? 2. What is the slope coefficient for the weight variable? Is this coefficient significant at 5% level of significance (alpha=0.05)? (Hint: Check the P-value, P>ltl, for weight in Python output. Recall that this is the individual t-test for the beta parameter.) See Step 5 in the Python script. 3. What is the slope coefficient for the horsepower variable? Is this coefficient significant at 5% level of significance (alpha=0.05)? (Hint: Check the P-value, p>Itl, for horsepower in Python output. Recall that this is the individual t-test for the beta parameter.) See Step 5 in the Python script. 4. What is the purpose of performing individual t-tests after carrying out the overall F-test? What are the differences in the interpretation of the two tests? 5. What is the coefficient of determination of your multiple regression model from Module Six? Provide appropriate interpretation of this statistic. Module Six Discussion: Multiple Regression This notebook contains the step-by-step directions for your Module Six discussion. It is very important to run through the steps in order. Some steps depend on the outputs of earlier steps. Once you have completed the steps in this notebook, be sure to answer the questions about this activity in the discussion for this module. Reminder: If you have not already reviewed the discussion prompt, please do so before beginning this activity. That will give you an idea of the questions you will need to answer with the outputs of this script. Initial post (due Thursday) Step 1: Generating cars dataset This block of Python code will generate the sample data for you. You will not be generating the data set using numpy module this week. Instead, the data set will be imported from a CSV file. To make the data unique to you, a random sample of size 30, without replacement, will be drawn from the data in the CSV file. The data set will be saved in a Python dataframe that will be used in later calculations. Click the block of code below and hit the Run button above. In [1]: import pandas as pd from IPython.display import display, HTML # read data from mtcars.csv data set. cars_df_orig = pd.read_csv("https://s3-us-west-2.amazonaws.com/data-analytics. zybooks.com/mtcars.csv") # randomly pick 30 observations from the data set to make the data set unique to you. cars_df cars_df_orig. sample (n=30, replace=False) # print only the first five observations in the dataset. print("Cars data frame (showing only the first five observations) ") display (HTML (cars_df.head().to_html())) Cars data frame (showing only the first five observations) Unnamed: 0 15 Lincoln Continental 8 Merc 230 20 Toyota Corona 31 Volvo 142E 24 Pontiac Firebird Step 2: Scatterplot of miles per gallon against weight The block of code below will create a scatterplot of the variables "miles per gallon" (coded as mpg in the data set) and "weight" of the car (coded as wt). Click the block of code below and hit the Run button above. NOTE: If the plot is not created, click the code section and hit the Run button again. In [8]: import matplotlib.pyplot as plt # create scatterplot of variables mpg against wt. plt.plot(cars_df["wt"], cars_df["mpg"], 'o', color='red') # set a title for the plot, x-axis, and y-axis. plt.title('MPG against Weight') # show the plot. plt.show() plt.xlabel('Weight (1000s lbs)') plt.ylabel('MPG') 35 30 25 20 15 10 Step 3: Scatterplot of miles per gallon against horsepower The block of code below will create a scatterplot of the variables "miles per gallon" (coded as mpg in the data set) and "horsepower" of the car (coded as hp). 15 2.0 25 Click the block of code below and hit the Run button above. NOTE: If the plot is not created, click the code section and hit the Run button again. In [3]: import matplotlib.pyplot as plt # show the plot. plt.show() 35 30 mpg |cyl disp hp drat wt 10.4 8 22.8 4 21.5 4 21.4 4 19.2 8 #create scatterplot of variables mpg against hp. plt.plot (cars_df["hp"], cars_df ["mpg"], 'o', color='blue') # set a title for the plot, x-axis, and y-axis. plt.title('MPG against Horsepower') plt.xlabel('Horsepower') plt.ylabel('MPG') 25 20 15 10 wt hp 460.0 215 3.00 5.424 140.8 95 3.92 3.150 22.90 1 120.1 97 3.70 2.465 20.01 1 121.0 109 4.11 2.780 18.60 1 1 0 400.0 175 3.08 3.845 17.05 0 50 MPG against Weight 3.0 3.5 4.0 45 5.0 5.5 Weight (1000s lbs) 100 MPG against Horsepower Dep. Variable: Model: Method: Date: Time: Step 4: Correlation matrix for miles per gallon, weight and horsepower Now you will calculate the correlation coefficient between the variables "miles per gallon" and "weight". You will also calculate the correlation coefficient between the variables "miles per gallon" and "horsepower". The corr method of a dataframe returns the correlation matrix with the correlation coefficients between all variables in the dataframe. You will specify to only return the matrix for the three variables. Click the block of code below and hit the Run button above. mpg hp mpg 1.000000 -0.870510 -0.809489 wt -0.870510 1.000000 0.730217 hp -0.809489 0.730217 1.000000 In [6]: # create correlation matrix for mpg, wt, and hp. # The correlation coefficient between mpg and wt is contained in the cell for mpg row and wt column (o r wt row and mpg column). No. Observations: Df Residuals: Df Model: Covariance Type: Intercept # The correlation coefficient between mpg and hp is contained in the cell for mpg row and hp column (o r hp row and mpg column). mpg_wt_corr = cars_df [['mpg', 'wt', 'hp']].corr() print(mpg_wt_corr) =========== Omnibus: Prob (Omnibus): Skew: Kurtosis: 150 Horsepower wt Step 5: Multiple regression model to predict miles per gallon using weight and horsepower This block of code produces a multiple regression model with "miles per gallon" as the response variable, and "weight" and "horsepower" as predictor variables. The ols method in statsmodels.formula.api submodule returns all statistics for this multiple regression model. Click the block of code below and hit the Run button above. In [5]: from statsmodels. formula.api import ols # create the multiple regression model with mpg as the response variable; weight and horsepower as pre dictor variables. model = ols('mpg ~ wt+hp', data-cars_df).fit() print (model. summary()) 200 coef qsec vs am gear carb 17.82 0 0 3 4 0 4 0 3 2 1 4 2 3 2 37.2151 -3.5923 -0.0386 250 OLS Regression Results mpg R-squared: OLS Adj. R-squared: Thu, 09 Feb 2023 17:14:45 Least Squares F-statistic: std err nonrobust 1.622 0.712 0.012 ================================= 30 AIC: 27 BIC: 2 Prob (F-statistic): Log-Likelihood: t 22.939 -5.044 -3.138 P>|t| 0.000 0.000 0.004 4.910 Durbin-Watson: 0.086 Jarque-Bera (JB): 0.838 Prob(JB): 3.306 Cond. No. [0.025 33.886 -5.054 -0.064 ============= 0.823 0.809 62.57 7.30e-11 -69.955 145.9 150.1 0.975] 40.544 -2.131 -0.013 2.104 3.625 0.163 524. ============================== Warnings: [1] Standard Errors assume that the covariance matrix of the errors is correctly specified. End of initial post Attach the HTML output to your initial post in the Module Six discussion. The HTML output can be downloaded by clicking File, then Download as, then HTML. Be sure to answer all questions about this activity in the Module Six discussion. Follow-up posts (due Sunday) Return to the Module Six discussion to answer the follow-up questions in your response posts to other students. There are no Python scripts to run for your follow-up posts. 1. Is at least one of the two variables (weight and horsepower) significant in the model? Run the overall F-test and provide your interpretation at 5% level of significance. See Step 5 in the Python script. Include the following in your analysis: a. Define the null and alternative hypothesis in mathematical terms and in words. b. Report the level of significance. c. Include the test statistic and the P-value. (Hint: F-Statistic and Prob (F- Statistic) in the output). d. Provide your conclusion and interpretation of the test. Should the null hypothesis be rejected? Why or why not? 2. What is the slope coefficient for the weight variable? Is this coefficient significant at 5% level of significance (alpha=0.05)? (Hint: Check the P-value, P>ltl, for weight in Python output. Recall that this is the individual t-test for the beta parameter.) See Step 5 in the Python script. 3. What is the slope coefficient for the horsepower variable? Is this coefficient significant at 5% level of significance (alpha=0.05)? (Hint: Check the P-value, p>Itl, for horsepower in Python output. Recall that this is the individual t-test for the beta parameter.) See Step 5 in the Python script. 4. What is the purpose of performing individual t-tests after carrying out the overall F-test? What are the differences in the interpretation of the two tests? 5. What is the coefficient of determination of your multiple regression model from Module Six? Provide appropriate interpretation of this statistic. Module Six Discussion: Multiple Regression This notebook contains the step-by-step directions for your Module Six discussion. It is very important to run through the steps in order. Some steps depend on the outputs of earlier steps. Once you have completed the steps in this notebook, be sure to answer the questions about this activity in the discussion for this module. Reminder: If you have not already reviewed the discussion prompt, please do so before beginning this activity. That will give you an idea of the questions you will need to answer with the outputs of this script. Initial post (due Thursday) Step 1: Generating cars dataset This block of Python code will generate the sample data for you. You will not be generating the data set using numpy module this week. Instead, the data set will be imported from a CSV file. To make the data unique to you, a random sample of size 30, without replacement, will be drawn from the data in the CSV file. The data set will be saved in a Python dataframe that will be used in later calculations. Click the block of code below and hit the Run button above. In [1]: import pandas as pd from IPython.display import display, HTML # read data from mtcars.csv data set. cars_df_orig = pd.read_csv("https://s3-us-west-2.amazonaws.com/data-analytics. zybooks.com/mtcars.csv") # randomly pick 30 observations from the data set to make the data set unique to you. cars_df cars_df_orig. sample (n=30, replace=False) # print only the first five observations in the dataset. print("Cars data frame (showing only the first five observations) ") display (HTML (cars_df.head().to_html())) Cars data frame (showing only the first five observations) Unnamed: 0 15 Lincoln Continental 8 Merc 230 20 Toyota Corona 31 Volvo 142E 24 Pontiac Firebird Step 2: Scatterplot of miles per gallon against weight The block of code below will create a scatterplot of the variables "miles per gallon" (coded as mpg in the data set) and "weight" of the car (coded as wt). Click the block of code below and hit the Run button above. NOTE: If the plot is not created, click the code section and hit the Run button again. In [8]: import matplotlib.pyplot as plt # create scatterplot of variables mpg against wt. plt.plot(cars_df["wt"], cars_df["mpg"], 'o', color='red') # set a title for the plot, x-axis, and y-axis. plt.title('MPG against Weight') # show the plot. plt.show() plt.xlabel('Weight (1000s lbs)') plt.ylabel('MPG') 35 30 25 20 15 10 Step 3: Scatterplot of miles per gallon against horsepower The block of code below will create a scatterplot of the variables "miles per gallon" (coded as mpg in the data set) and "horsepower" of the car (coded as hp). 15 2.0 25 Click the block of code below and hit the Run button above. NOTE: If the plot is not created, click the code section and hit the Run button again. In [3]: import matplotlib.pyplot as plt # show the plot. plt.show() 35 30 mpg |cyl disp hp drat wt 10.4 8 22.8 4 21.5 4 21.4 4 19.2 8 #create scatterplot of variables mpg against hp. plt.plot (cars_df["hp"], cars_df ["mpg"], 'o', color='blue') # set a title for the plot, x-axis, and y-axis. plt.title('MPG against Horsepower') plt.xlabel('Horsepower') plt.ylabel('MPG') 25 20 15 10 wt hp 460.0 215 3.00 5.424 140.8 95 3.92 3.150 22.90 1 120.1 97 3.70 2.465 20.01 1 121.0 109 4.11 2.780 18.60 1 1 0 400.0 175 3.08 3.845 17.05 0 50 MPG against Weight 3.0 3.5 4.0 45 5.0 5.5 Weight (1000s lbs) 100 MPG against Horsepower Dep. Variable: Model: Method: Date: Time: Step 4: Correlation matrix for miles per gallon, weight and horsepower Now you will calculate the correlation coefficient between the variables "miles per gallon" and "weight". You will also calculate the correlation coefficient between the variables "miles per gallon" and "horsepower". The corr method of a dataframe returns the correlation matrix with the correlation coefficients between all variables in the dataframe. You will specify to only return the matrix for the three variables. Click the block of code below and hit the Run button above. mpg hp mpg 1.000000 -0.870510 -0.809489 wt -0.870510 1.000000 0.730217 hp -0.809489 0.730217 1.000000 In [6]: # create correlation matrix for mpg, wt, and hp. # The correlation coefficient between mpg and wt is contained in the cell for mpg row and wt column (o r wt row and mpg column). No. Observations: Df Residuals: Df Model: Covariance Type: Intercept # The correlation coefficient between mpg and hp is contained in the cell for mpg row and hp column (o r hp row and mpg column). mpg_wt_corr = cars_df [['mpg', 'wt', 'hp']].corr() print(mpg_wt_corr) =========== Omnibus: Prob (Omnibus): Skew: Kurtosis: 150 Horsepower wt Step 5: Multiple regression model to predict miles per gallon using weight and horsepower This block of code produces a multiple regression model with "miles per gallon" as the response variable, and "weight" and "horsepower" as predictor variables. The ols method in statsmodels.formula.api submodule returns all statistics for this multiple regression model. Click the block of code below and hit the Run button above. In [5]: from statsmodels. formula.api import ols # create the multiple regression model with mpg as the response variable; weight and horsepower as pre dictor variables. model = ols('mpg ~ wt+hp', data-cars_df).fit() print (model. summary()) 200 coef qsec vs am gear carb 17.82 0 0 3 4 0 4 0 3 2 1 4 2 3 2 37.2151 -3.5923 -0.0386 250 OLS Regression Results mpg R-squared: OLS Adj. R-squared: Thu, 09 Feb 2023 17:14:45 Least Squares F-statistic: std err nonrobust 1.622 0.712 0.012 ================================= 30 AIC: 27 BIC: 2 Prob (F-statistic): Log-Likelihood: t 22.939 -5.044 -3.138 P>|t| 0.000 0.000 0.004 4.910 Durbin-Watson: 0.086 Jarque-Bera (JB): 0.838 Prob(JB): 3.306 Cond. No. [0.025 33.886 -5.054 -0.064 ============= 0.823 0.809 62.57 7.30e-11 -69.955 145.9 150.1 0.975] 40.544 -2.131 -0.013 2.104 3.625 0.163 524. ============================== Warnings: [1] Standard Errors assume that the covariance matrix of the errors is correctly specified. End of initial post Attach the HTML output to your initial post in the Module Six discussion. The HTML output can be downloaded by clicking File, then Download as, then HTML. Be sure to answer all questions about this activity in the Module Six discussion. Follow-up posts (due Sunday) Return to the Module Six discussion to answer the follow-up questions in your response posts to other students. There are no Python scripts to run for your follow-up posts.
Expert Answer:

Related Book For 

Applied Regression Analysis and Other Multivariable Methods
ISBN: 978-1285051086
5th edition
Authors: David G. Kleinbaum, Lawrence L. Kupper, Azhar Nizam, Eli S. Rosenberg
Posted Date:
Students also viewed these programming questions
-
Suppose management of Spartan Cabinets has developed additional information for the project described in problem 10: To illustrate, activity A can be crashed by up to 3 weeks, at a cost of $2,000 per...
-
MUST BE CORRECT ANSWERS A small software company has the following simplified cashflow, funded by shareholders' equity of 20,000 and a bank overdraft of 5000: Invoiced money received 2 months after...
-
Two franchising experts recently debated the issue of whether new college graduates should consider franchising as a pathway to entrepreneurship. Jeff Elgin said recent college graduates are not...
-
The accountant for Bannister Co. posted all amounts correctly from the cash receipts journal to the general ledger. However, she failed to post three credits to customer accounts in the accounts...
-
Outline the different methods for combining forecast models explained in the chapter. Can more than two forecasting models be combined into a single model? Does each of the original forecasts have to...
-
How does encapsulation protect the object from an intruder?
-
Create a list of user requirements for the problem definition created in Problem 4.
-
2-1. GASB Concepts Statement No. 3 discusses various methods of communicating financial accounting information to users. One method is using required supple- mentary information (RSI). What is RSI,...
-
Freshy Bhd is primarily engaged in the worldwide production, processing, distribution, and marketing of food products. Comparative financial statements of Freshy Bhd for the year 2015 and 2016 are as...
-
Define the term epigenetics, and describe two examples of epigenetic effects.
-
A seed dealer wants to sell four-oclock seeds that will produce only a single color of flowers (red, white, or pink). Explain how this should be done.
-
A true-breeding tall pea plant was crossed to a true-breeding dwarf plant. What is the probability that an F1 individual will be truebreeding? What is the probability that an F1 individual will be a...
-
With regard to sister chromatids, which phase of mitosis is the organization phase, and which is the separation phase?
-
Which mechanism of bacterial genetic transfer does not require recombination with the bacterial chromosome?
-
Give a calculus proof that the line from the focus to a point on a parabola makes an angle with the tangent at that point equal to that made by a line parallel to the axis.
-
Why is the national security argument for tariffs questionable?
-
Suppose that, in a study to compare body sizes of three genotypes of fourth-instar silkworms, the mean lengths (in millimeters) for separately reared cocoons of heterozygous (HET), homozygous (HOM),...
-
A psychiatrist wants to know whether the level of pathology (Y) in psychotic patients 6 months after treatment can be predicted with reasonable accuracy from knowledge of pretreatment symptom ratings...
-
The manager of a market research company conducted an experiment to investigate the productivity of three employees on each of two computerized data-entry systems. The employees conducted phone...
-
The circuit in Figure P32.96 represents your planned design for a wall power supply that will run a radio that usually runs on a 9-V battery. The power supply uses a transformer (not shown) to...
-
Your boss has purchased a new AC power source to run a high-voltage, low-current display, but it is not working. While he is fuming, you look at the owner's manual and discover that this power source...
-
Construct a phasor diagram representing the current and potential difference in Figure 32. 10 at \(t=T / 4, T / 2\), and \(3 T / 4\). Data from Figure 32.10 Ve maximum, current zero Ve minimum,...

Study smarter with the SolutionInn App