

Question: 1. Is PED liquid compared to its peers? 2. Does PED manage its assets effectively compared to its peers? 3. Does the company's debt load
1. Is PED liquid compared to its peers? 2. Does PED manage its assets effectively compared to its peers? 3. Does the company's debt load suggest trouble paying its creditors? 4. Compare the company's profitability to its peers.
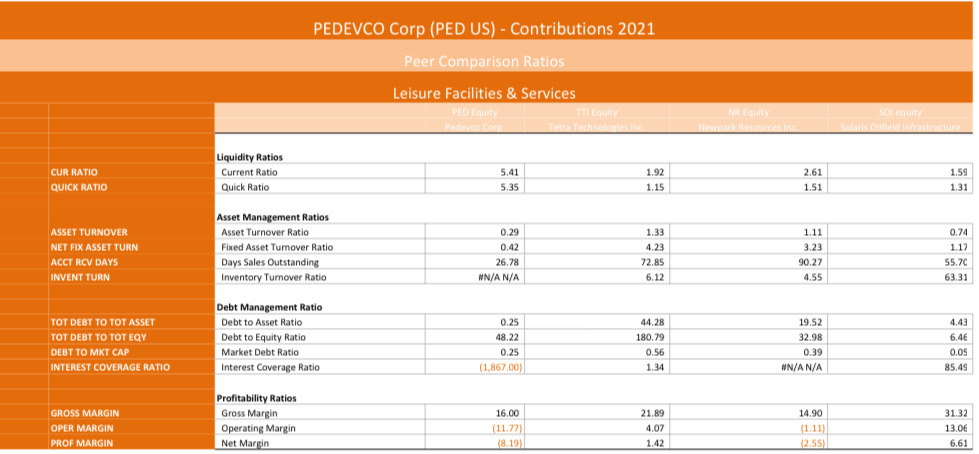
CUR RATIO QUICK RATIO ASSET TURNOVER NET FIX ASSET TURN ACCT RCV DAYS INVENT TURN TOT DEBT TO TOT ASSET TOT DEBT TO TOT EQY DEBT TO MKT CAP INTEREST COVERAGE RATIO GROSS MARGIN OPER MARGIN PROF MARGIN Liquidity Ratios Current Ratio Quick Ratio PEDEVCO Corp (PED US) - Contributions 2021 Peer Comparison Ratios Leisure Facilities & Services PED Equity TTI Equity Pedevco Corp Tetra Technologies Inc. Asset Management Ratios Asset Turnover Ratio Fixed Asset Turnover Ratio Days Sales Outstanding Inventory Turnover Ratio Debt Management Ratio Debt to Asset Ratio Debt to Equity Ratio Market Debt Ratio Interest Coverage Ratio Profitability Ratios Gross Margin Operating Margin Net Margin 5.41 5.35 0.29 0.42 26.78 #N/A N/A 0.25 48.22 0.25 (1,867.00) 16.00 (11.77) (8.19) 1.92 1.15 1.33 4.23 72.85 6.12 44.28 180.79 0.56 1.34 21.89 4.07 1.42 NR Equity Newpark Resources Inc. 2.61 1.51 1.11 3.23 90.27 4.55 19.52 32.98 0.39 #N/A N/A 14.90 (1.11) (2.55) SOI equity Solaris Oilfield Infrastructure 1.59 1.31 0.74 1.17 55.70 63.31 4.43 6.46 0.05 85.49 31.32 13.06 6.61
Step by Step Solution
There are 3 Steps involved in it
Based on the provided data and ratios lets analyze PEDs performance compared to its peers in each as... View full answer

Get step-by-step solutions from verified subject matter experts