

Question: Using the provided financial data about Jarir Marketing Co., solve Questions 1 to 8. Additional information was provided to help you out in in solving
Using the provided financial data about Jarir Marketing Co., solve Questions 1 to 8. Additional information was provided to help you out in in solving some of the questions in table 1 to 9.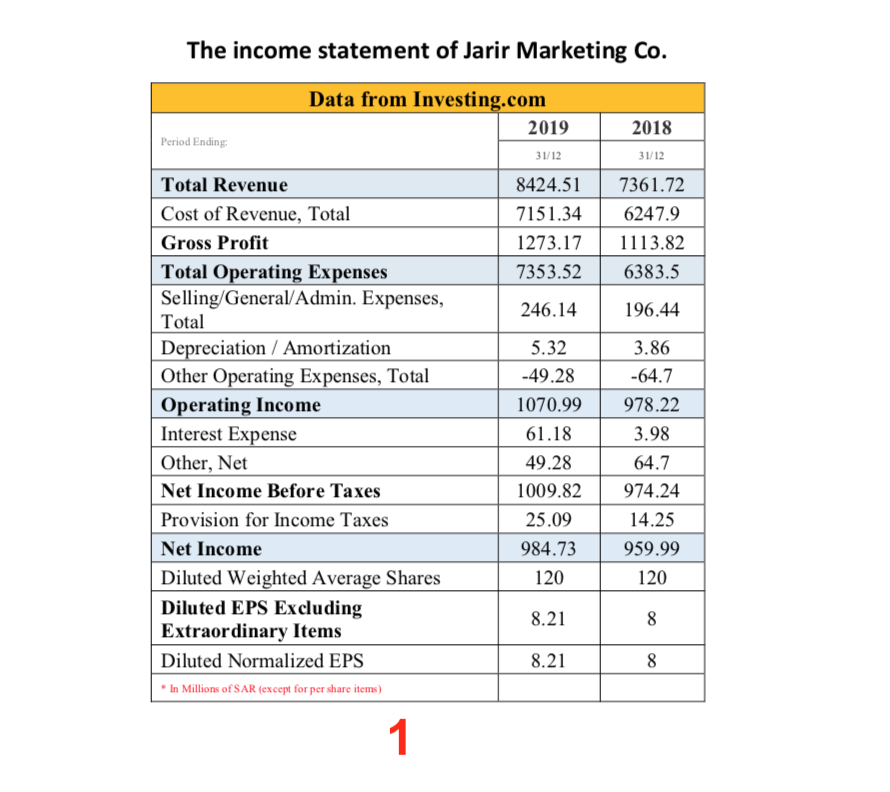
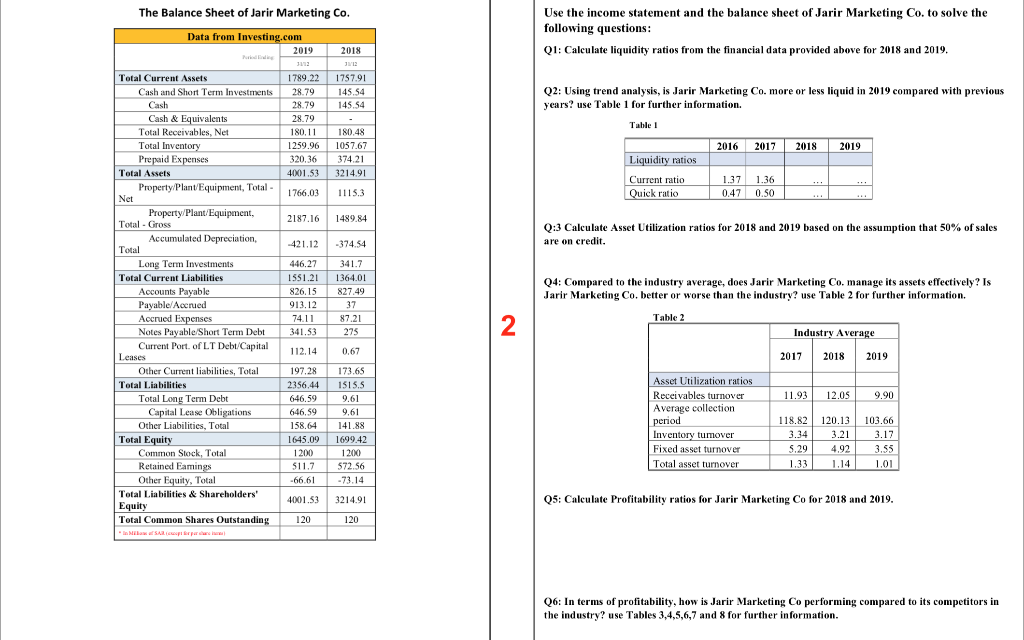
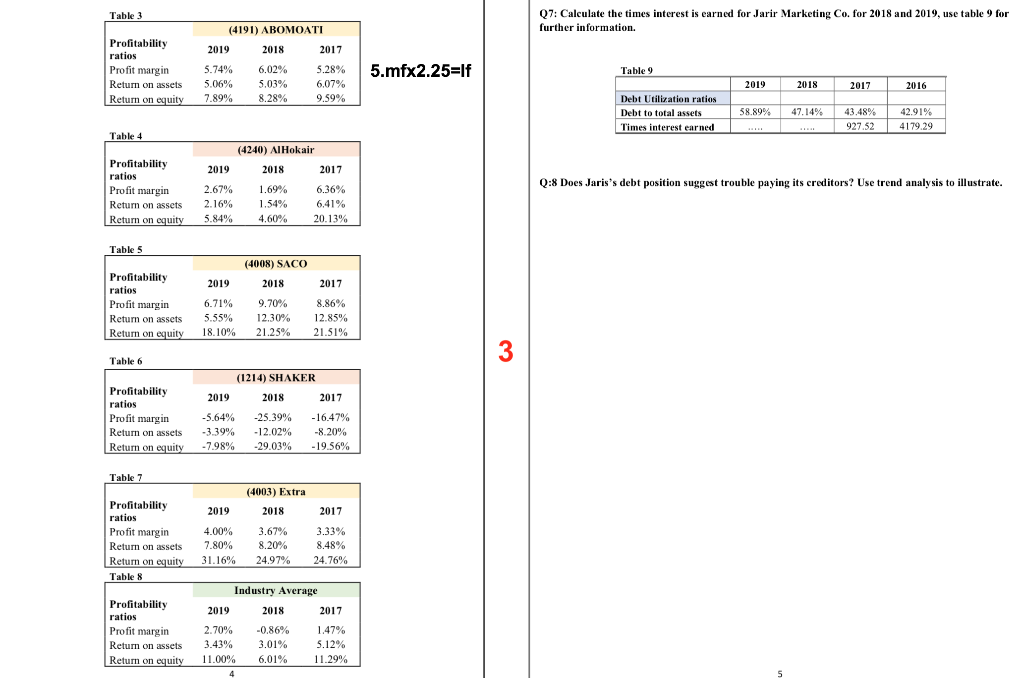
The income statement of Jarir Marketing Co. Data from Investing.com 2019 Period Ending 31/12 8424.51 7151.34 1273.17 7353.52 2018 31/12 7361.72 6247.9 1113.82 6383.5 246.14 196.44 Total Revenue Cost of Revenue, Total Gross Profit Total Operating Expenses Selling/General/Admin. Expenses, Total Depreciation / Amortization Other Operating Expenses, Total Operating Income Interest Expense Other, Net Net Income Before Taxes Provision for Income Taxes Net Income Diluted Weighted Average Shares Diluted EPS Excluding Extraordinary Items Diluted Normalized EPS * In Millions of SAR (except for per share items) 5.32 -49.28 1070.99 61.18 49.28 1009.82 25.09 984.73 120 3.86 -64.7 978.22 3.98 64.7 974.24 14.25 959.99 120 8.21 8 8.21 8 1 The Balance Sheet of Jarir Marketing Co. Use the income statement and the balance sheet of Jarir Marketing Co. to solve the following questions: Q1: Calculate liquidity ratios from the financial data provided above for 2018 and 2019. Data from Investing.com 2019 2018 WE 1757.91 145.54 145.54 Q2: Using trend analysis, is Jarir Marketing Co. more or less liquid in 2019 compared with previous years? use Table 1 for further information. 1789.22 28.79 28.79 28.79 180,11 1259.96 320,36 4001.53 Table 1 2016 2017 2018 2019 180.48 1057.67 374.21 321491 Liquidity ratios Current ratio Quick ratio 1.37 1.36 0.47 0.50 1766.03 1115,3 2187.16 1489.84 Q:3 Calculate Asset Utilization ratios for 2018 and 2019 based on the assumption that 50% of sales are on credit. 421.12 -374.54 Total Current Assets Cash and Short Term Investments Cash Cash & Equivalents Total Receivables, Net Total Inventory Prepaid Expenses Total Assets Property Plant Equipment, Total Net Property/Plant/Equipment, Total - Gross Accumulated Depreciation, Total Long Term Investments Total Current Liabilities Accounts Payable Payable/Accrued Accried Expenses Notes Payable/Short Term Debt Current Port of LT Debt Capital Leases Other Current liabilities, Total Total Liabilities Total Long Term Debt Capital Lease Obligations Other Liabilities, Total Total Equity Common Stock, Total Retained Eamings Other Equity, Total Total Liabilities & Shareholders' Equity Total Common Shares Outstanding 446.27 1551.21 826,15 913.12 74.11 341.53 341.7 1364.01 827.49 37 87.21 273 04: Compared to the industry average, does Jarir Marketing Co. manage its assets effectively? Is Jarir Marketing Co, better or worse than the industry? use Table 2 for further information. Table 2 Industry Average 2. 112.14 2017 2018 2019 11.93 12.05 9.90 197.28 2356.44 646,59 646,59 158.64 1645.09 1200 $11.7 -66.61 173.65 1515.5 9.61 9,61 141.88 1699.42 1200 572.56 -73.14 3214.91 Asset Utilization ratios Receivables turnover Average collection period Inventory tumover Fixed asset turnover Total asset turnover 118.82 120.13 103.66 3.34 3.21 3.17 5.29 4.92 3.55 1.33 1,01 4001.53 Q5: Calculate Profitability ratios for Jarir Marketing Co for 2018 and 2019. 120 120 Q6: In terms of profitability, how is Jarir Marketing Co performing compared to its competitors in the industry? use Tables 3,4,5,6,7 and 8 for further information. Table 3 Q7: Calculate the times interest is earned for Jarir Marketing Co. for 2018 and 2019, use table 9 for further information. (4191) ABOMOATI 2019 2018 2017 Profitability ratios Profit margin Return on assets Return on equity 5.mfx2.25=If Table 9 5.74% 5.06% 7.89% 6.02% 5.03% 8.28% 5.28% 6,07% 9.59% 2019 2018 2017 2016 Debt Utilization ratios Debt to total assets Times interest earned 58.89% 47.14% 43.48% 927.52 42.9194 4179.29 Table 4 Profitability (4240) AIHokair 2018 2017 2019 ratios Q:8 Does Jaris's debt position suggest trouble paying its creditors? Use trend analysis to illustrate. Profit margin Return on assets Return on equity 2.67% 2.16% 5.84% 1.69% 1.54% 4.60% 6.36% 6,41% 20.13% Table 5 (4008) SACO 2019 2018 2017 Profitability ratios Profit margin Return on assets Return on equity 6.71% 5.55% 18.10% % 9.70% 12.30% 21.25% 8.86% 12.85% 21.51% 3 Table 6 6 (1214) SHAKER 2019 2018 2017 Profitability ratios Profit margin Return on assets Retum on equity -5.64% -3.39% -7.98% -25.39% -12.02% -29.03% -16.47% -8.20% -19.56% Table 7 (4003) Extra 2018 2019 2017 Profitability ratios Profit margin Return on assets Retum on equity Table 8 4.00% 7.80% 31.16% 3.67% 8.20% 24.97% 3.33% 8.48% 24.76% Industry Average 2019 2018 2017 Profitability ratios Profit margin Return on assets Return on equity 2.70% 3.43% 11.00% -0.86% 3.01% 6.01% 1.47% 5.12% 11.29% 4 The income statement of Jarir Marketing Co. Data from Investing.com 2019 Period Ending 31/12 8424.51 7151.34 1273.17 7353.52 2018 31/12 7361.72 6247.9 1113.82 6383.5 246.14 196.44 Total Revenue Cost of Revenue, Total Gross Profit Total Operating Expenses Selling/General/Admin. Expenses, Total Depreciation / Amortization Other Operating Expenses, Total Operating Income Interest Expense Other, Net Net Income Before Taxes Provision for Income Taxes Net Income Diluted Weighted Average Shares Diluted EPS Excluding Extraordinary Items Diluted Normalized EPS * In Millions of SAR (except for per share items) 5.32 -49.28 1070.99 61.18 49.28 1009.82 25.09 984.73 120 3.86 -64.7 978.22 3.98 64.7 974.24 14.25 959.99 120 8.21 8 8.21 8 1 The Balance Sheet of Jarir Marketing Co. Use the income statement and the balance sheet of Jarir Marketing Co. to solve the following questions: Q1: Calculate liquidity ratios from the financial data provided above for 2018 and 2019. Data from Investing.com 2019 2018 WE 1757.91 145.54 145.54 Q2: Using trend analysis, is Jarir Marketing Co. more or less liquid in 2019 compared with previous years? use Table 1 for further information. 1789.22 28.79 28.79 28.79 180,11 1259.96 320,36 4001.53 Table 1 2016 2017 2018 2019 180.48 1057.67 374.21 321491 Liquidity ratios Current ratio Quick ratio 1.37 1.36 0.47 0.50 1766.03 1115,3 2187.16 1489.84 Q:3 Calculate Asset Utilization ratios for 2018 and 2019 based on the assumption that 50% of sales are on credit. 421.12 -374.54 Total Current Assets Cash and Short Term Investments Cash Cash & Equivalents Total Receivables, Net Total Inventory Prepaid Expenses Total Assets Property Plant Equipment, Total Net Property/Plant/Equipment, Total - Gross Accumulated Depreciation, Total Long Term Investments Total Current Liabilities Accounts Payable Payable/Accrued Accried Expenses Notes Payable/Short Term Debt Current Port of LT Debt Capital Leases Other Current liabilities, Total Total Liabilities Total Long Term Debt Capital Lease Obligations Other Liabilities, Total Total Equity Common Stock, Total Retained Eamings Other Equity, Total Total Liabilities & Shareholders' Equity Total Common Shares Outstanding 446.27 1551.21 826,15 913.12 74.11 341.53 341.7 1364.01 827.49 37 87.21 273 04: Compared to the industry average, does Jarir Marketing Co. manage its assets effectively? Is Jarir Marketing Co, better or worse than the industry? use Table 2 for further information. Table 2 Industry Average 2. 112.14 2017 2018 2019 11.93 12.05 9.90 197.28 2356.44 646,59 646,59 158.64 1645.09 1200 $11.7 -66.61 173.65 1515.5 9.61 9,61 141.88 1699.42 1200 572.56 -73.14 3214.91 Asset Utilization ratios Receivables turnover Average collection period Inventory tumover Fixed asset turnover Total asset turnover 118.82 120.13 103.66 3.34 3.21 3.17 5.29 4.92 3.55 1.33 1,01 4001.53 Q5: Calculate Profitability ratios for Jarir Marketing Co for 2018 and 2019. 120 120 Q6: In terms of profitability, how is Jarir Marketing Co performing compared to its competitors in the industry? use Tables 3,4,5,6,7 and 8 for further information. Table 3 Q7: Calculate the times interest is earned for Jarir Marketing Co. for 2018 and 2019, use table 9 for further information. (4191) ABOMOATI 2019 2018 2017 Profitability ratios Profit margin Return on assets Return on equity 5.mfx2.25=If Table 9 5.74% 5.06% 7.89% 6.02% 5.03% 8.28% 5.28% 6,07% 9.59% 2019 2018 2017 2016 Debt Utilization ratios Debt to total assets Times interest earned 58.89% 47.14% 43.48% 927.52 42.9194 4179.29 Table 4 Profitability (4240) AIHokair 2018 2017 2019 ratios Q:8 Does Jaris's debt position suggest trouble paying its creditors? Use trend analysis to illustrate. Profit margin Return on assets Return on equity 2.67% 2.16% 5.84% 1.69% 1.54% 4.60% 6.36% 6,41% 20.13% Table 5 (4008) SACO 2019 2018 2017 Profitability ratios Profit margin Return on assets Return on equity 6.71% 5.55% 18.10% % 9.70% 12.30% 21.25% 8.86% 12.85% 21.51% 3 Table 6 6 (1214) SHAKER 2019 2018 2017 Profitability ratios Profit margin Return on assets Retum on equity -5.64% -3.39% -7.98% -25.39% -12.02% -29.03% -16.47% -8.20% -19.56% Table 7 (4003) Extra 2018 2019 2017 Profitability ratios Profit margin Return on assets Retum on equity Table 8 4.00% 7.80% 31.16% 3.67% 8.20% 24.97% 3.33% 8.48% 24.76% Industry Average 2019 2018 2017 Profitability ratios Profit margin Return on assets Return on equity 2.70% 3.43% 11.00% -0.86% 3.01% 6.01% 1.47% 5.12% 11.29% 4
Step by Step Solution
There are 3 Steps involved in it

Get step-by-step solutions from verified subject matter experts