

Question: 1. Is the graph shown a probability distribution of 2. Is the graph shown a probability distribution a discrete random variable? Why or why not?
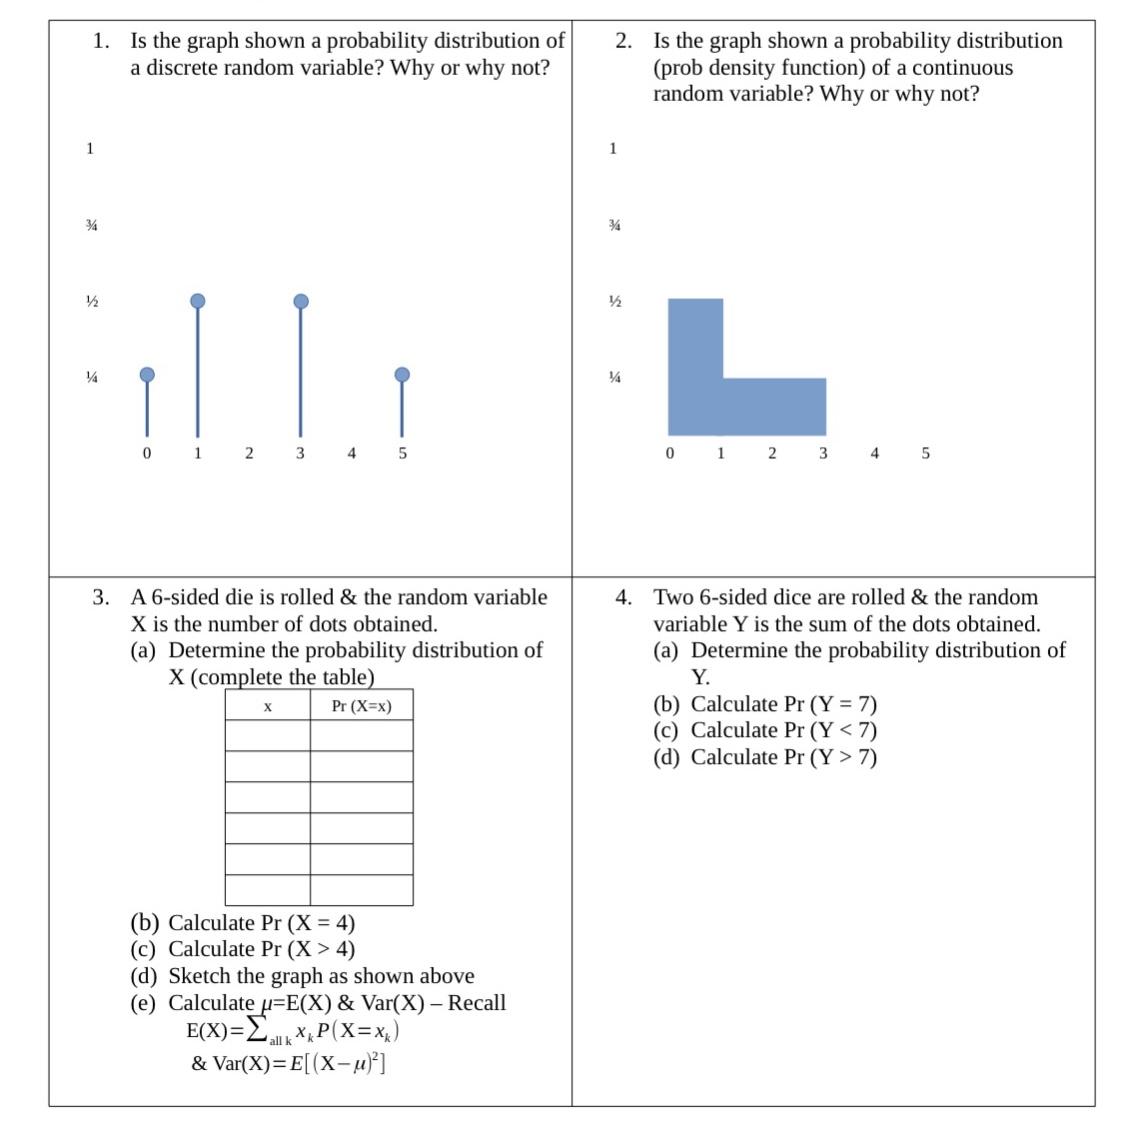
1. Is the graph shown a probability distribution of 2. Is the graph shown a probability distribution a discrete random variable? Why or why not? (prob density function) of a continuous random variable? Why or why not? 3. A 6-sided die is rolled 8: the random variable 4. Two 6-sided dice are rolled 8: the random X is the number of dots obtained. variable Y is the sum of the dots obtained. (a) Determine the probability distribution of (a) Determine the probability distribution of X (com lete the table Y (b) Calculate Pr {Y = 7) (c) Calculate Pr (Y 7) (b) Calculate Pr (X = 4) (c) Calculate Pr (X > 4) (d) Sketch the graph as shown above (e) Calculate =E(X) & Var(X) Recall Eon: mxtPIX=xJ &Var(X)=E[{Xn)2]
Step by Step Solution
There are 3 Steps involved in it

Get step-by-step solutions from verified subject matter experts