

Question: A restaurant manager tracks complaints from the diner satisfaction cards that are turned in at each table. The data collected from the past week's
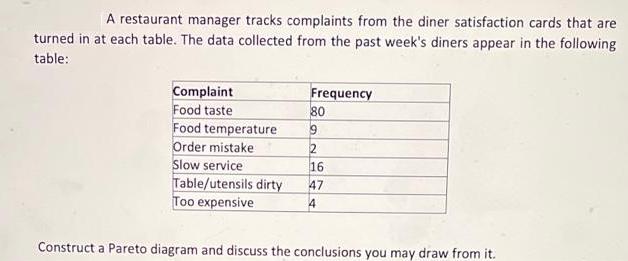
A restaurant manager tracks complaints from the diner satisfaction cards that are turned in at each table. The data collected from the past week's diners appear in the following table: Complaint Food taste Food temperature Order mistake Slow service Table/utensils dirty Too expensive Frequency 80 9 2 16 47 4 Construct a Pareto diagram and discuss the conclusions you may draw from it.
Step by Step Solution
3.49 Rating (172 Votes )
There are 3 Steps involved in it
Question Pareto diagram for the given data Complaint Frequency Percentage Cumulative frequency Food ... View full answer

Get step-by-step solutions from verified subject matter experts