

Question: 1 . Make a fully labeled control chart showing upper and lower control limits and the median line. 2 . What are Common Cause and
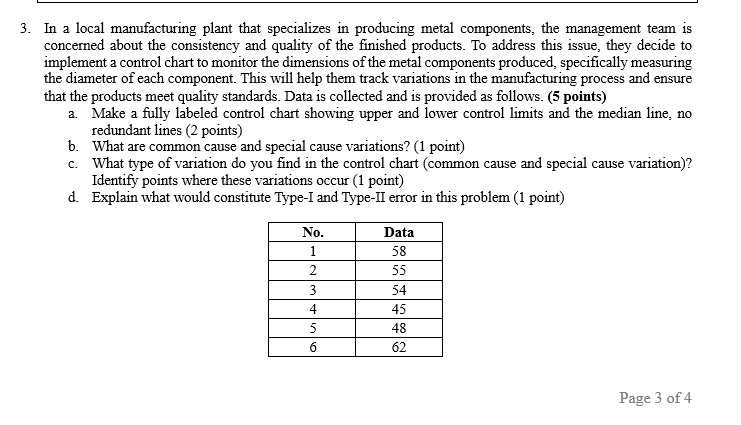
Make a fully labeled control chart showing upper and lower control limits and the median line.
What are Common Cause and Special Cause variations?
What type of variation you find in the chart that is common cause and special cause variation Identify points where these variations occur
Explain what would constitute TypeI and TypeII error in this problem.
Step by Step Solution
There are 3 Steps involved in it
1 Expert Approved Answer
Step: 1 Unlock

Question Has Been Solved by an Expert!
Get step-by-step solutions from verified subject matter experts
Step: 2 Unlock
Step: 3 Unlock