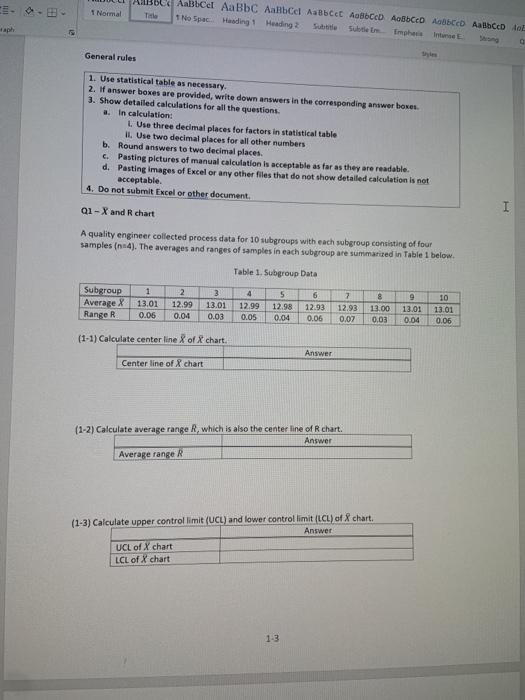
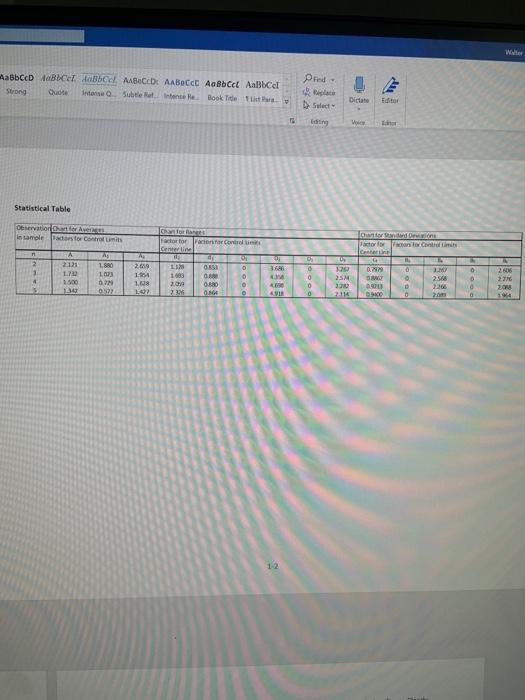
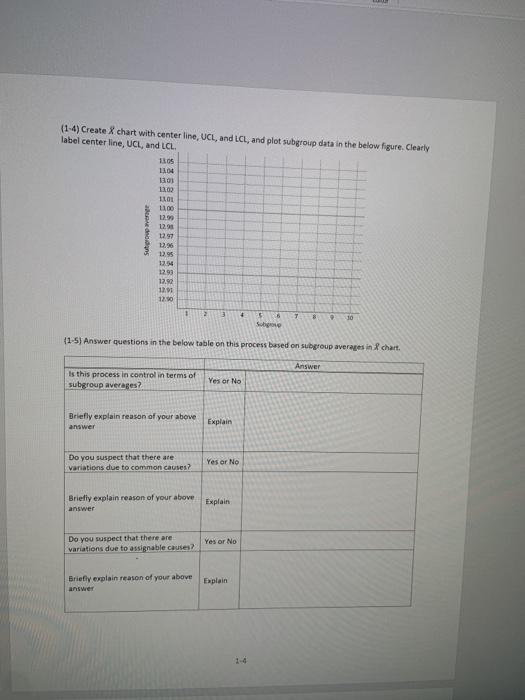
Question: 1 Normal AaBbce AaBC Aalbod AaBbcet ABCD AbbCD ABC Aalbcd to No SpacHanding 1 Heading? Title General rules 1. Use statistical table as necessary 2.

1 Normal AaBbce AaBC Aalbod AaBbcet ABCD AbbCD
1 Normal AaBbce AaBC Aalbod AaBbcet ABCD AbbCD ABC Aalbcd to No SpacHanding 1 Heading? Title General rules 1. Use statistical table as necessary 2. If answer boxes are provided, write down answers in the corresponding answer boxes 3. Show detailed calculations for all the questions a in calculation L. Use three decimal places for factors in statistical table il. Use two decimal places for all other numbers b. Round answers to two decimal places c. Pasting pictures of manual calculation is acceptable as far as they are readable. d. Pasting images of Excel or any other files that do not show detailed calculation is not acceptable. 4. Do not submit Excel or other document. Q1-X and R chart I A quality engineer collected process data for 10 subgroups with each subgroup consisting of four samples (4). The averages and ranges of samples in each subgroup are summarised in Table 1 below. Table 1. Subgroup Data 7 Subgroup 1 Average X 13.01 Range R 0.06 2 12.99 0.04 3 13.01 0.03 4 12.99 0.05 5 12.98 0.04 6 12.93 8 13.00 0.03 12.93 0.07 9 13.01 0.04 10 13.01 0.06 0.06 (1-1) Calculate center line of chart Answer Center line of X chart (1-2) Calculate average range R, which is also the center line of chart. Answer Average range R (1-3) Calculate upper controllimit (UCL) and lower controllimit (LCL) of chart Answer UCL of X chart LCL of X chart 1-3 Water AabbCcDAoBel tabac ABCDL A BOCC ABCck AaBbce Strong Quote Into Sublette Book Title Tit. pred E Didae ding Statistical Table Oervation ONLARI sample castor Controls for Factor centerline Factor for a los HA 2121 L 1880 1073 DES 1 ON 0 2.619 1:14 1.08 Blood LI 1.685 2009 724 25 4 190 0 0 0.680 OB 200 2568 2266 130 POD 1920 2. 200 0927 VIR (1-4) Create X chart with center line, UCL, and LCL, and plot subgroup data in the below figure. Clearly label center line, UCL, and LCL 110 1104 110 120 110 100 12.99 12.95 1297 12.96 12.95 12.04 1293 12.92 12.01 12.50 dans 1 + 7 8 5 Sobgroue 10 (1-5) Answer questions in the below table on this process based on subgroup averages in & chart. Answer Is this process in control in terms of subgroup averages? Yes or No Briefly explain reason of your above answer Explain Do you suspect that there are variations due to common causes? Yes or No Briefly explain reason of your above answer Explain Do you suspect that there are variations due to assignable causes? Yes or No Briefly explain reason of your above answer Explain

Step by Step Solution

There are 3 Steps involved in it

1 Expert Approved Answer
Step: 1 Unlock blur-text-image
Question Has Been Solved by an Expert!

Get step-by-step solutions from verified subject matter experts

Step: 2 Unlock
Step: 3 Unlock

Students Have Also Explored These Related General Management Questions!