

Question: 1.) On a single chart, plot the value of $1 invested in each of the five indexes over time. I.e., for all t, plot the
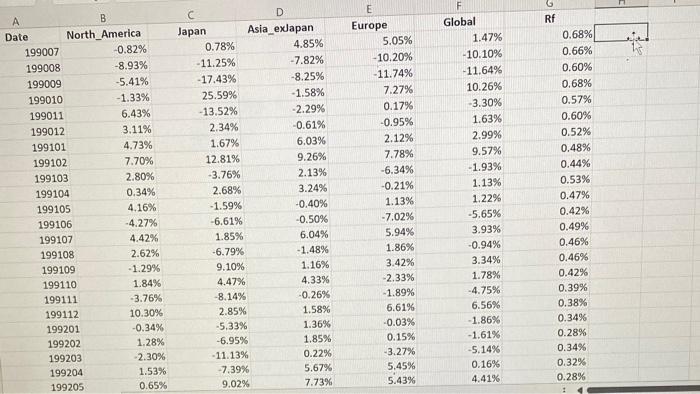

1.) On a single chart, plot the value of $1 invested in each of the five indexes over time. I.e., for all t, plot the cumulative return series for each index: TVt=(1+r1)(1+r2)(1+rt) What patterns do you observe? (10 points) 2.) Plot a histogram of only the Global index returns. Does the distribution look normal? ( 5 points) 1.) On a single chart, plot the value of $1 invested in each of the five indexes over time. I.e., for all t, plot the cumulative return series for each index: TVt=(1+r1)(1+r2)(1+rt) What patterns do you observe? (10 points) 2.) Plot a histogram of only the Global index returns. Does the distribution look normal? ( 5 points)
Step by Step Solution
There are 3 Steps involved in it
1 Expert Approved Answer
Step: 1 Unlock

Question Has Been Solved by an Expert!
Get step-by-step solutions from verified subject matter experts
Step: 2 Unlock
Step: 3 Unlock