

1. On March 3, 2024, the LSEG stock reports plus shows that 40 sell-side analysts' forecasts...
Fantastic news! We've Found the answer you've been seeking!
Question:
Transcribed Image Text:
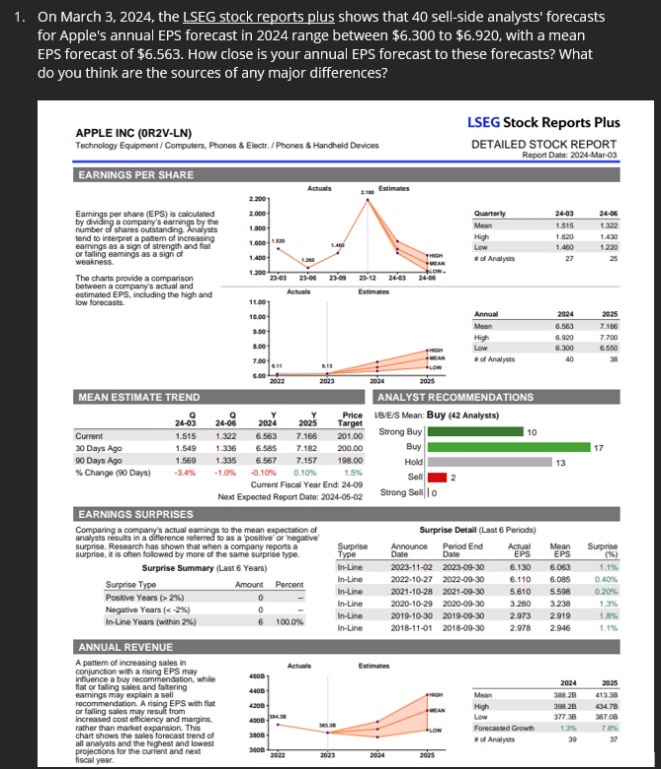
1. On March 3, 2024, the LSEG stock reports plus shows that 40 sell-side analysts' forecasts for Apple's annual EPS forecast in 2024 range between $6.300 to $6.920, with a mean EPS forecast of $6.563. How close is your annual EPS forecast to these forecasts? What do you think are the sources of any major differences? APPLE INC (0R2V-LN) Technology Equipment/Computers, Phones & Electr./Phones & Handheld Devices EARNINGS PER SHARE LSEG Stock Reports Plus DETAILED STOCK REPORT Report Date: 2024-Mar-03 Actuals Estimates 2.2001 Earnings per share (EPS) is calculated by dividing a company's earnings by the number of shares outstanding. Analysts tend to interpret a pattem of increasing earnings as a sign of strength and flat or falling eamings as a sign of weakness. The charts provide a comparison between a company's actual and estimated EPS, including the high and low forecasts. 2.000 1.800 1.600 152 MEAN ESTIMATE TREND Quarterly 24-03 24-06 Mean 1.515 1.322 High 1.620 1.430 Low 1.460 1.220 1.400- #of Analysts 27 25 1.200 23-03 23-06 23-09 23-12 24-03 24-06 Actuals 11.001 10.00 9.00 8.00 Annual 2024 2025 Mean 6.563 7.166 High 6.920 7.700 Low 6.300 6.550 40 6.13 2022 2023 2025 ANALYST RECOMMENDATIONS IBE/S Mean: Buy (42 Analysts) Strong Buy 24-03 24-06 2024 Current 1.515 1.322 Price 2025 Target 6.563 7.166 201.00 30 Days Ago 90 Days Ago % Change (90 Days) 1.549 1.336 6.585 7.182 1.569 1.335 6.567 7.157 -3.4% -1.0% -0.10% 0.10% Current Fiscal Year End: 24-09 Next Expected Report Date: 2024-05-02 200.00 198.00 Buy Hold 1.5% Sell Strong Sell o 10 17 EARNINGS SURPRISES Comparing a company's actual eamings to the mean expectation of analysts results in a difference referred to as a positive or negative surprise. Research has shown that when a company reports a surprise, it is often followed by more of the same surprise type. Surprise Summary (Last 6 Years) Surprise Detail (Last 6 Periods) Surprise Announce Period End Actual Mean Type Date Date EPS EPS Surprise (%) In-Line 2023-11-02 2023-09-30 6.130 6.063 1.1% In-Line 2022-10-27 2022-09-30 6.110 6.085 Surprise Type Positive Years (>2%) Negative Years ( < < -2%) 0.40% Amount Percent In-Line 2021-10-28 2021-09-30 5.610 5.598 0.20% 0 In-Line 2020-10-29 2020-09-30 3.280 3.238 1.3% In-Line In-Line Years (within 2%) 6 100.0% In-Line 2019-10-30 2019-09-30 2018-11-01 2018-09-30 2.973 2.919 1.8% 2.978 2.946 1.1% ANNUAL REVENUE A pattern of increasing sales in Actuals conjunction with a rising EPS may earnings may explain a sell influence a buy recommendation, while flat or falling sales and faltering 4608 440B 4208- recommendation. A rising EPS with flat or falling sales may result from increased d cost efficiency and margins, rather than market expansion. This chart shows the sales forecast trend of all analysts and the highest and lowest projections for the current and next fiscal year. HIGH Mean 2024 388.28 2025 413.38 High 398.2B 434.7B Low LOW Forecasted Growth of Analysts 377.38 1.3% 387.08 7.8% 39 37 3800 3608- 2022 2023 2024 2025 1. On March 3, 2024, the LSEG stock reports plus shows that 40 sell-side analysts' forecasts for Apple's annual EPS forecast in 2024 range between $6.300 to $6.920, with a mean EPS forecast of $6.563. How close is your annual EPS forecast to these forecasts? What do you think are the sources of any major differences? APPLE INC (0R2V-LN) Technology Equipment/Computers, Phones & Electr./Phones & Handheld Devices EARNINGS PER SHARE LSEG Stock Reports Plus DETAILED STOCK REPORT Report Date: 2024-Mar-03 Actuals Estimates 2.2001 Earnings per share (EPS) is calculated by dividing a company's earnings by the number of shares outstanding. Analysts tend to interpret a pattem of increasing earnings as a sign of strength and flat or falling eamings as a sign of weakness. The charts provide a comparison between a company's actual and estimated EPS, including the high and low forecasts. 2.000 1.800 1.600 152 MEAN ESTIMATE TREND Quarterly 24-03 24-06 Mean 1.515 1.322 High 1.620 1.430 Low 1.460 1.220 1.400- #of Analysts 27 25 1.200 23-03 23-06 23-09 23-12 24-03 24-06 Actuals 11.001 10.00 9.00 8.00 Annual 2024 2025 Mean 6.563 7.166 High 6.920 7.700 Low 6.300 6.550 40 6.13 2022 2023 2025 ANALYST RECOMMENDATIONS IBE/S Mean: Buy (42 Analysts) Strong Buy 24-03 24-06 2024 Current 1.515 1.322 Price 2025 Target 6.563 7.166 201.00 30 Days Ago 90 Days Ago % Change (90 Days) 1.549 1.336 6.585 7.182 1.569 1.335 6.567 7.157 -3.4% -1.0% -0.10% 0.10% Current Fiscal Year End: 24-09 Next Expected Report Date: 2024-05-02 200.00 198.00 Buy Hold 1.5% Sell Strong Sell o 10 17 EARNINGS SURPRISES Comparing a company's actual eamings to the mean expectation of analysts results in a difference referred to as a positive or negative surprise. Research has shown that when a company reports a surprise, it is often followed by more of the same surprise type. Surprise Summary (Last 6 Years) Surprise Detail (Last 6 Periods) Surprise Announce Period End Actual Mean Type Date Date EPS EPS Surprise (%) In-Line 2023-11-02 2023-09-30 6.130 6.063 1.1% In-Line 2022-10-27 2022-09-30 6.110 6.085 Surprise Type Positive Years (>2%) Negative Years ( < < -2%) 0.40% Amount Percent In-Line 2021-10-28 2021-09-30 5.610 5.598 0.20% 0 In-Line 2020-10-29 2020-09-30 3.280 3.238 1.3% In-Line In-Line Years (within 2%) 6 100.0% In-Line 2019-10-30 2019-09-30 2018-11-01 2018-09-30 2.973 2.919 1.8% 2.978 2.946 1.1% ANNUAL REVENUE A pattern of increasing sales in Actuals conjunction with a rising EPS may earnings may explain a sell influence a buy recommendation, while flat or falling sales and faltering 4608 440B 4208- recommendation. A rising EPS with flat or falling sales may result from increased d cost efficiency and margins, rather than market expansion. This chart shows the sales forecast trend of all analysts and the highest and lowest projections for the current and next fiscal year. HIGH Mean 2024 388.28 2025 413.38 High 398.2B 434.7B Low LOW Forecasted Growth of Analysts 377.38 1.3% 387.08 7.8% 39 37 3800 3608- 2022 2023 2024 2025
Expert Answer:

Related Book For 

Posted Date:
Students also viewed these finance questions
-
Planning is one of the most important management functions in any business. A front office managers first step in planning should involve determine the departments goals. Planning also includes...
-
Managing Scope Changes Case Study Scope changes on a project can occur regardless of how well the project is planned or executed. Scope changes can be the result of something that was omitted during...
-
Discuss the interface between Purchasing and Supply Management and Logistics Management specifically with respect to selection of a third party logistics provider, analysis of the total cost of...
-
Storico Co. just paid a dividend of $2.65 per share. 7Z. The company will increase its dividend by 20 percent next year and will then reduce its dividend growth rate by 5 percentage points per year...
-
What is the difference in the burden of proof between criminal and civil law?
-
Show that during the early part of the electron-positron annihilation era, the ratio of the electron number density to the photon number density scaled with temperature as \[\frac{n_{-}}{n_{\gamma}}...
-
Alvamar Company has the following data for the weekly payroll ending January 31 Employees are paid 112 times the regular hourly rate for all hours worked in excess of 40 hours per week. FICA taxes...
-
We need to map following EERD into RELATIONAL MODEL. Map the following EERD into relational model ArtistNumber Artist Name N FormationDate Group Group-Member SoloPerformer BirthDate JoinedDate...
-
The wave free" of a particle at a certain insteint is given by 4(x) = A exb [-x + ikx] If Pj k lz fa deno of the probabilities of finding the partile in the songe a to atda respectively. find the...
-
Consider the reported major explosion at a nuclear plant, using groupthink as the tool of analysis of the event.
-
Describe the approach adopted by Katz and Kahn to the sources of resistance to change, and state how it differs from that suggested by Bedeian and Zammuto.
-
Dons business buys three motor vehicles for the business and pays by debit card between 1 July 2021 and 30 June 2022. As a result of the nature of the business, each motor vehicle is put to a special...
-
Reflect on the nature and distribution of power within organizations.
-
Assess ways in which technology, both old and new, influences organization.
-
Figure 12.7 shows a branched system in which the pressure at A is 700 kPa and the pressure at B is 550 kPa. Each branch is 60 m long. Neglect losses at the junctions, but consider all elbows. If the...
-
For the next several days, take notes on your listening performance during at least a half-dozen situations in class, during social activities, and at work, if applicable. Referring to the traits of...
-
A marine biologist wishes to use parrot fish for experimental purposes due to the belief that their weight is fairly stable (i.e., the variability in weights among parrot fish is small). The...
-
The Journal of Natural History (May 2010) published the results of a study that investigated which of six species of slime molds are most attractive to beetles inhabiting an Atlantic rain forest. A...
-
The vineyards in the Bordeaux region of France are known for producing excellent red wines. However, the uncertainty of the weather during the growing season, the phenomenon that wine tastes better...
-
In 1984, the number of German marks required to buy one U.S. dollar was 1.80. In 1987, the U.S. dollar was worth 2.00 marks. In 1992, the dollar was worth 1.50 marks. In 1997, the dollar was again...
-
Todays spot rate is S 0 $ = $0.009057355. The 90-day forward rate is F 1 $ = $0.008772945. a. Calculate the forward premium on Japanese yen in basis points and as a percentage premium or discount...
-
Describe locational, triangular, and covered interest arbitrage.

Study smarter with the SolutionInn App