

Question: 1. Optimizing Performance: Finally. you'll decide on an optimal solution that will maximize the organization's objectives. You'l need to think about the level of sensitivity
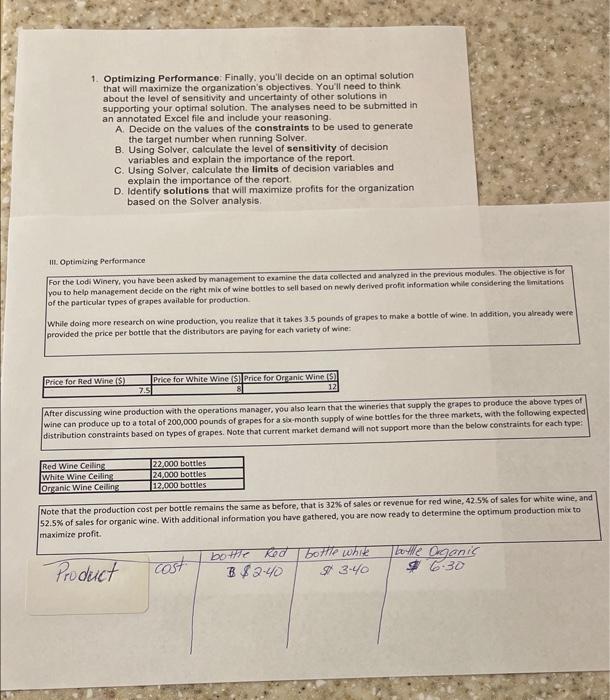
1. Optimizing Performance: Finally. you'll decide on an optimal solution that will maximize the organization's objectives. You'l need to think about the level of sensitivity and uncertainty of other solutions in supporting your optimal solution. The analyses need to be submitted in an annotated Excel file and include your reasoning. A. Decide on the values of the constraints to be used to generate the target number when running Solver. B. Using Solver, calculate the level of sensitivity of decision variables and explain the importance of the report. C. Using Solver, calculate the limits of decision variables and explain the importance of the report. D. Identify solutions that will maximize profits for the organization based on the Solver analysis. III. Optimizing Performance For the Lodi Winery, vou have been asked by management to examine the data collected and analyred in the previous modules. The objective is for you to help management decide on the right mix of wine bottles to sell based on newly derived peofit information while considerirth the fimitations of the particular types of grapes available for production. While doing more research on wine production, you realize that it takes 3.5 pounds of grapes to make a bottle of wine. In addition, you already were provided the price per bottle that the distributors are paying for each variety of wine: After discussing wine production with the operations manager, you also learn that the wineries that supply the grapes to produce the abewe types of wine can produce up to a total of 200,000 pounds of grapes for a six-month supply of wine bottles for the three markets, with the following expected distribution constraints based on types of grapes. Note that current market demand will not support more than the below constraints for each type: Note that the production cost per bottle remains the same as before, that is 32% of sales or revenue for red wine, 42.5% of sales for white wine, and Note that the production cost per bottle remains the same as before, that is 32 of of sales or revenue for red wor organic wine. With additional information you have gathered, you are now ready to determine the optimum production mix to maximize profit. 1. Optimizing Performance: Finally. you'll decide on an optimal solution that will maximize the organization's objectives. You'l need to think about the level of sensitivity and uncertainty of other solutions in supporting your optimal solution. The analyses need to be submitted in an annotated Excel file and include your reasoning. A. Decide on the values of the constraints to be used to generate the target number when running Solver. B. Using Solver, calculate the level of sensitivity of decision variables and explain the importance of the report. C. Using Solver, calculate the limits of decision variables and explain the importance of the report. D. Identify solutions that will maximize profits for the organization based on the Solver analysis. III. Optimizing Performance For the Lodi Winery, vou have been asked by management to examine the data collected and analyred in the previous modules. The objective is for you to help management decide on the right mix of wine bottles to sell based on newly derived peofit information while considerirth the fimitations of the particular types of grapes available for production. While doing more research on wine production, you realize that it takes 3.5 pounds of grapes to make a bottle of wine. In addition, you already were provided the price per bottle that the distributors are paying for each variety of wine: After discussing wine production with the operations manager, you also learn that the wineries that supply the grapes to produce the abewe types of wine can produce up to a total of 200,000 pounds of grapes for a six-month supply of wine bottles for the three markets, with the following expected distribution constraints based on types of grapes. Note that current market demand will not support more than the below constraints for each type: Note that the production cost per bottle remains the same as before, that is 32% of sales or revenue for red wine, 42.5% of sales for white wine, and Note that the production cost per bottle remains the same as before, that is 32 of of sales or revenue for red wor organic wine. With additional information you have gathered, you are now ready to determine the optimum production mix to maximize profit
Step by Step Solution
There are 3 Steps involved in it
To solve this problem using Excel Solver follow these steps Step 1 Set Up the Excel Spreadsheet 1 In... View full answer

Get step-by-step solutions from verified subject matter experts