

Question: 1. Perform common size analysis and ration Analysis 2. For the Common Size Analysis, prepare the common size income statement and balance sheet for 2018
1. Perform common size analysis and ration Analysis
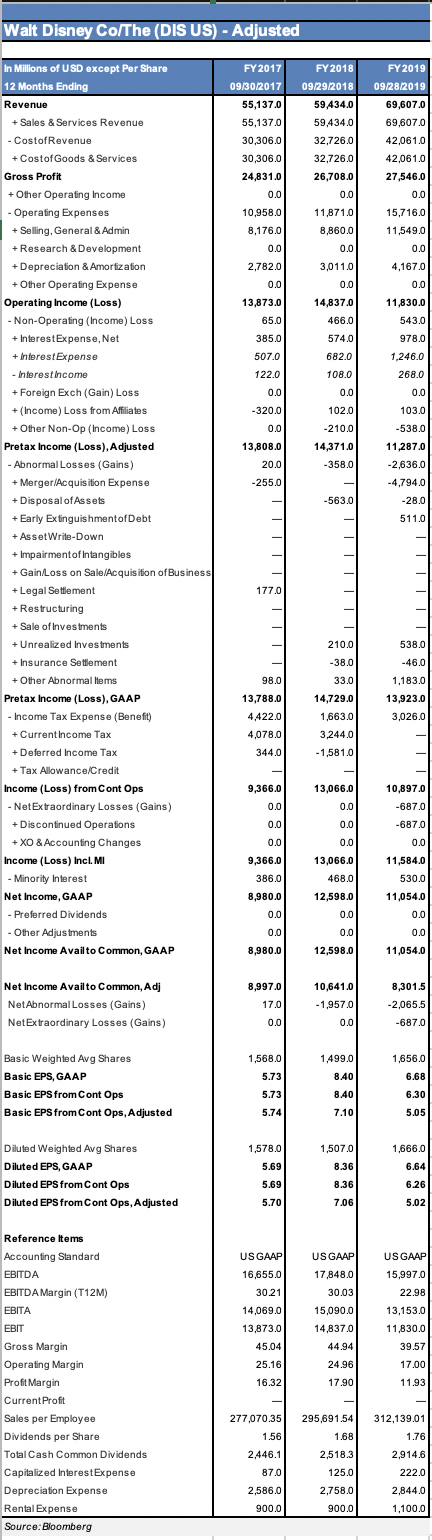
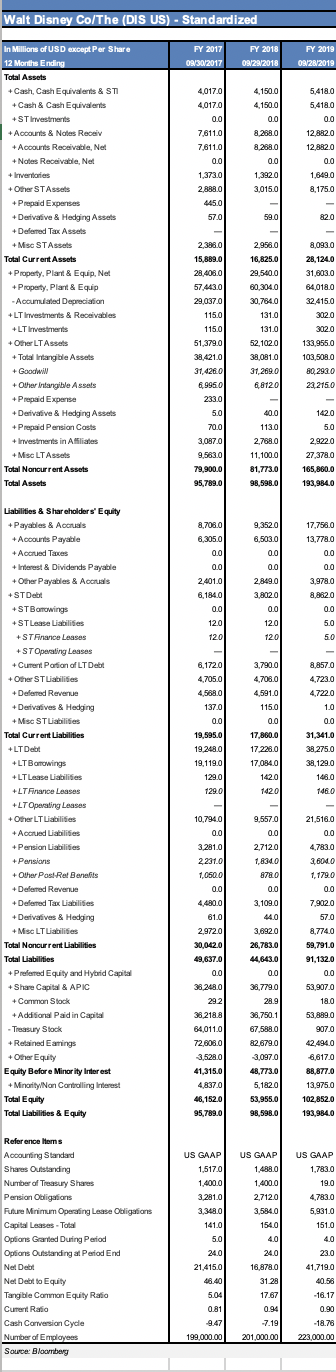
2. For the Common Size Analysis, prepare the common size income statement and balance sheet for 2018 and 2019. Explain if there are any significant changes.
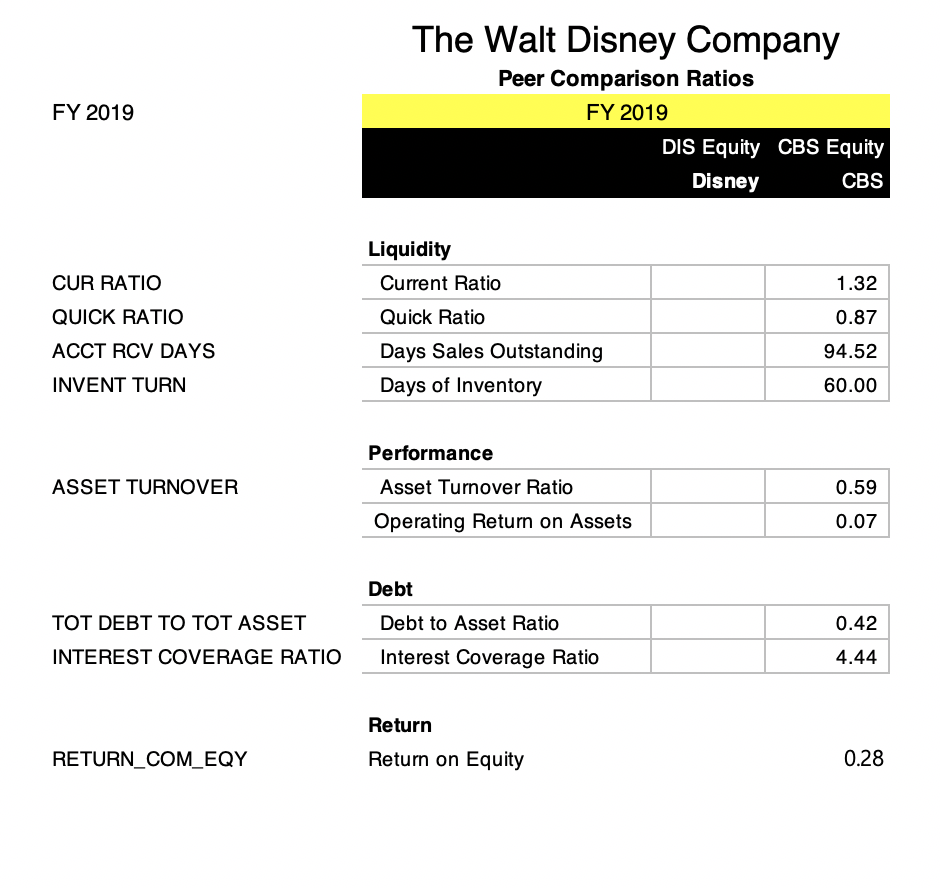
3. For the Ratio Analysis compute the following ratios:
Liquidity: Current Ratio, Quick Ratio, Days in Receivables, Days of Inventory
Performance: Total Asset Turnover, Operating Return on Assets
Financing: Total debt-to-assets ratio (Debt ratio), Times Interest Earned
Returns: Return on Equity
Walt Disney Co/The (DIS US) - Adjusted FY2017 09/30/2017 55,137,0 55,137.0 FY 2018 09/29/2018 59434.0 59.434.0 32,726.0 32,726.0 FY2019 09/28/2019 69,607.0 69,607.0 42,061.0 30,306.0 30,306,0 24,831.0 0.0 10,958.0 8,176.0 0.0 26,708.0 0.0 42,061.0 27,546.0 0.0 11,871.0 8,860.0 0.0 3,011.0 15,716,0 11,549.0 0.0 2,782.0 0.0 4,167.0 0.0 0.0 13,873.0 65.0 385.0 14,837,0 466.0 574.0 11,830.0 543.0 978.0 507.0 1,246.0 268.0 122.0 0.0 682.0 108.0 0.0 102.0 0.0 103.0 -320.0 0.0 -538.0 13,808.0 20.0 -210.0 14,371.0 -358.0 -255.0 In Millions of USD except Per Share 12 Months Ending Revenue + Sales & Services Revenue - CostofRevenue + CostofGoods & Services Gross Profit + Other Operating Income -Operating Expenses + Selling, General & Admin + Research & Development +Depreciation & Amortization + Other Operating Expense Operating Income (Loss) - Non-Operating (Income) Loss + Interest Expense, Net + Interest Expense - Interest Income + Foreign Exch (Gain) Loss + (Income) Loss from Affiliates + Other Non-Op (Income) Loss Pretax Income (Loss), Adjusted - Abnormal Losses (Gains) + Merger/Acquisition Expense + Disposal of Assets + Early ExtinguishmentofDebt + Asset Write-Down + ImpairmentofIntangibles +Gain/Loss on Sale/Acquisition of Business +Legal Settlement + Restructuring + Sale of Investments + Unrealized Investments + Insurance Settlement + Other Abnormal Moms Pretax Income (Loss), GAAP - Income Tax Expense (Benefit) + Current Income Tax + Deferred Income Tax + Tax Allowance/Credit Income (Loss) from Cont Ops - NetExtraordinary Losses (Gains) + Discontinued Operations + XO & Accounting Changes Income (Loss) Incl. Mi Minority Interest Net Income, GAAP - Preferred Dividends - Other Adjustments Net Income Availto Common, GAAP 11,287,0 -2.636.0 -4.794.0 -28.0 511.0 -563.0 = 177.0 210.0 -38.0 33.0 538.0 -46.0 1,183.0 98.0 13,788.0 13,923.0 3,026.0 4,422.0 4,078,0 344.0 14,729.0 1,663.0 3.244.0 - 1,581.0 - 9,366.0 0.0 13,066.0 0.0 10,897.0 -687.0 0.0 0.0 -687.0 0.0 0.0 0.0 9,366.0 386.0 8,980.0 0.0 13,066.0 468.0 12,598.0 0.0 11,584.0 530.0 11,054.0 0.0 0.0 0.0 0.0 8,980.0 12,598.0 11,054.0 8,997.0 Net Income Availto Common, Adj NetAbnormal Losses (Gains) NetExtraordinary Losses (Gains) 10,641.0 -1,957.0 0.0 8,301.5 -2,065.5 17.0 0.0 -687.0 1,568.0 1,499.0 8.40 1,656.0 6.68 Basic Weighted Avg Shares Basic EPS, GAAP , Basic EPS from Cont Ops Basic EPS from Cont Ops, Adjusted 5.73 5.73 8.40 7.10 6.30 5.05 5.74 1,666.0 1,578.0 5.69 1,507.0 8.36 Diluted Weighted Avg Shares Diluted EPS, GAAP Diluted EPS from Cont Ops Diluted EPS from Cont Ops, Adjusted 6.64 6.26 8.36 5.69 5.70 7.06 5.02 US GAAP) US GAAP 16,655.0 30.21 14,069.0 13,873.0 17,848.0 30.03 US GAAP 15,997.0 22.98 13,153.0 11,830.0 15,090.0 14,837.0 45.04 44.94 Reference Items Accounting Standard EBITDA EBITDA Margin (T12M) EBITA EBIT Gross Margin Operating Margin Profit Margin Current Profit Sales per Employee Dividends per Share Total Cash Common Dividends Capitalized Interest Expense Depreciation Expense Rental Expense Source: Bloomberg 25.16 16.32 24.96 17.90 39.57 17.00 11.93 - 277,070.35 1.56 295,691.54 1.68 2,518.3 312,139.01 1.76 2,914.6 2.446.1 87.0 2,586.0 125.0 2,758.0 900.0 222.0 2,844.0 1,100.0 900.0 Walt Disney Co/The (DIS US) - Standardized FY 2017 09/30/2017 FY 2018 09/29/2018 FY 2019 09/28/2019 4,017.0 4,017.0 0.0 7.611.0 7.611.0 0.01 4.150.0 4.150.0 0.0 8.288.0 8,288.0 0.0 1,392.0 3.015.0 5.418.0 5.418.0 0.0 12,882.0 12,882.0 0.0 1,649.0 8,175.0 1,373.0 2.888.0 445.0 57.0 59.0 82.0 In Millions of USD except Per Share 12 Months Ending Total Assets Cash Cash Equivalents & STI + Cash & Cash Equivalents + ST Investments + Accounts & Notes Receiv + Accounts Receivable, Net +Notes Receivable, Net + Inventories + Other ST Assets + Prepaid Expenses + Derivative & Hedging Assets +Deferred Tax Assets + Misc ST Assets Total Current Assets + Property, Plant & Equip.Net + Property, Plant & Equip Accumulated Depreciation +LT Investments & Receivables +LT Investments + Other LT Assets + Total Intangible Assets + Goodwill + Other Intangible Assets + Prepaid Expense + Derivative & Hedging Assets + Prepaid Pension Costs + Investments in Affiliates + Misc LT Assets Total Noncurrent Assets Total Assets 2,386.0 15,889.0 28,408.0 57.443.0 29,0370 115.0 2.958.0 16,825.0 29,540.0 80,304.0 30,764.0 131.0 131.0 52,102.0 38,081.0 31,269.0 6,8120 8,093.0 28.1240 31 8030 64,018.0 32.415.0 302.0 302.0 115.0 51,379.0 133.955.0 103,508.0 80,293.0 23.215.0 38,421.0 31,426.0 6.9950 233.0 5.0 70.0 40.0 142.0 113.0 5.0 2.922.0 3.087.0 9,563.0 79,900.0 27,378.0 2,768.0 11.100.0 81,773.0 98,598.0 165,860.0 193,984.0 95,789.0 8,708.0 6,305.0 0.0 17.758.0 13.778.0 9,352.0 6,503.0 0.0 0.0 0.0 2.401.0 6,184.0 0.0 12.0 2.849.0 3,802.0 0.0 0.0 0.0 3.978.0 8,882.0 0.0 5.0 50 12.0 120 120 6.172.0 4.705.0 4,588.0 137.0 3.790.0 4,708.0 4,591.0 115.0 0.0 8.857.0 4.723.0 4.7220 1.0 0.0 0.0 19,595.0 19.248.0 19.119.0 129.0 17,860.0 17 226.0 17.084.0 142.0 31,341.0 38.275.0 38,129,0 148.0 129.0 1420 1460 Liabilities & Shareholders' Equity + Payables & Accruals + Accounts Payable + Accrued Taxes +Interest & Dividends Payable + Other Payables & Access +STDb +ST Borowings +ST Lease Liabilities +ST Finance Leases +ST Operating Leases + Cument Portion of LT Debt + Other ST Liabilities + Deferred Revenue + Derivatives & Hedging + Misc ST Liabilities Total Current Liabilities +LTDb +LT Bomowings +LT Lease Liabilities +LT Finance Leases +LT Operating Leases + Other LT Liabilities + Accrued Liabilities + Pension Liabilities + Pensions + Other Post Ret Benefits + Deferred Revenue +Deferred Tax Liabilities Derivatives & Hedging + Misc LT Liabilities Total Noncurrent Liabilities Total Liabilities Preferred Equity and Hybrid Capital + Share Capital & APIC + Common Stock + Additional Paid in Capital - Treasury Stock +Retained Earnings Other Equity Equity Before Minority Interest + Minority Non Controlling interest Total Equity Total Liabilities & Equity 9,557.0 0.0 21,516.0 0.0 4.783.0 10.794.0 0.0 3.281.0 2.231.0 1,050.0 0.0 4.480.0 2,712.0 1,834.0 8780 0.0 3.109.0 44.0 3,604.0 1,179.0 0.0 7,902.0 57.0 8.774.0 61.0 2,972.0 30.042.0 49,637,0 59,791.0 91,132.0 0.0 53,9070 0.0 3.692.0 26,783.0 44.643.0 0.0 38,779.0 28.9 38,750.1 67,588.0 82,679.0 3.0970 18.0 38.248.0 292 38.218.8 64,011.0 72,608.0 3,528.0 41,315.0 4,8370 46, 152.0 95,789.0 53,889.0 907.0 42.494.0 6,617.0 88,877.0 13,975.0 48,773.0 5.182.0 53,955.0 98,598.0 102,852.0 193,9840 US GAAP 1.488.0 1.400.0 Reference Items Accounting Standard Shares Outstanding Number of Treasury Shares Pension Obligations Future Minimum Operating Lease Obligations Capital Leases. Total Options Granted During Period Options Outstanding at Period End Net Debt Net Debt to Equity Tangible Common Equity Ratio Current Ratio Cash Conversion Cycle Number of Employees Source: Bloomberg US GAAP 1,517.0 1.400.0 3.281.0 3.3480 141.0 5.0 24.0 21.415.0 48.40 2,712.0 3,584.0 154.0 4.0 24.0 16,878.0 31.28 17.67 0.94 -7.19 US GAAP 1.783.0 19.0 4.783.0 5,931.0 151.0 4.0 23.0 41,719.0 40.56 -16.17 0.90 5.04 0.81 -18.76 223,000.00 199,000.00 201,000.00 FY 2019 The Walt Disney Company Peer Comparison Ratios FY 2019 DIS Equity CBS Equity Disney CBS CUR RATIO QUICK RATIO ACCT RCV DAYS INVENT TURN Liquidity Current Ratio Quick Ratio Days Sales Outstanding Days of Inventory 1.32 0.87 94.52 60.00 ASSET TURNOVER Performance Asset Turnover Ratio Operating Return on Assets 0.59 0.07 TOT DEBT TO TOT ASSET INTEREST COVERAGE RATIO Debt Debt to Asset Ratio Interest Coverage Ratio 0.42 4.44 Return Return on Equity RETURN_COM_EQY 0.28 Walt Disney Co/The (DIS US) - Adjusted FY2017 09/30/2017 55,137,0 55,137.0 FY 2018 09/29/2018 59434.0 59.434.0 32,726.0 32,726.0 FY2019 09/28/2019 69,607.0 69,607.0 42,061.0 30,306.0 30,306,0 24,831.0 0.0 10,958.0 8,176.0 0.0 26,708.0 0.0 42,061.0 27,546.0 0.0 11,871.0 8,860.0 0.0 3,011.0 15,716,0 11,549.0 0.0 2,782.0 0.0 4,167.0 0.0 0.0 13,873.0 65.0 385.0 14,837,0 466.0 574.0 11,830.0 543.0 978.0 507.0 1,246.0 268.0 122.0 0.0 682.0 108.0 0.0 102.0 0.0 103.0 -320.0 0.0 -538.0 13,808.0 20.0 -210.0 14,371.0 -358.0 -255.0 In Millions of USD except Per Share 12 Months Ending Revenue + Sales & Services Revenue - CostofRevenue + CostofGoods & Services Gross Profit + Other Operating Income -Operating Expenses + Selling, General & Admin + Research & Development +Depreciation & Amortization + Other Operating Expense Operating Income (Loss) - Non-Operating (Income) Loss + Interest Expense, Net + Interest Expense - Interest Income + Foreign Exch (Gain) Loss + (Income) Loss from Affiliates + Other Non-Op (Income) Loss Pretax Income (Loss), Adjusted - Abnormal Losses (Gains) + Merger/Acquisition Expense + Disposal of Assets + Early ExtinguishmentofDebt + Asset Write-Down + ImpairmentofIntangibles +Gain/Loss on Sale/Acquisition of Business +Legal Settlement + Restructuring + Sale of Investments + Unrealized Investments + Insurance Settlement + Other Abnormal Moms Pretax Income (Loss), GAAP - Income Tax Expense (Benefit) + Current Income Tax + Deferred Income Tax + Tax Allowance/Credit Income (Loss) from Cont Ops - NetExtraordinary Losses (Gains) + Discontinued Operations + XO & Accounting Changes Income (Loss) Incl. Mi Minority Interest Net Income, GAAP - Preferred Dividends - Other Adjustments Net Income Availto Common, GAAP 11,287,0 -2.636.0 -4.794.0 -28.0 511.0 -563.0 = 177.0 210.0 -38.0 33.0 538.0 -46.0 1,183.0 98.0 13,788.0 13,923.0 3,026.0 4,422.0 4,078,0 344.0 14,729.0 1,663.0 3.244.0 - 1,581.0 - 9,366.0 0.0 13,066.0 0.0 10,897.0 -687.0 0.0 0.0 -687.0 0.0 0.0 0.0 9,366.0 386.0 8,980.0 0.0 13,066.0 468.0 12,598.0 0.0 11,584.0 530.0 11,054.0 0.0 0.0 0.0 0.0 8,980.0 12,598.0 11,054.0 8,997.0 Net Income Availto Common, Adj NetAbnormal Losses (Gains) NetExtraordinary Losses (Gains) 10,641.0 -1,957.0 0.0 8,301.5 -2,065.5 17.0 0.0 -687.0 1,568.0 1,499.0 8.40 1,656.0 6.68 Basic Weighted Avg Shares Basic EPS, GAAP , Basic EPS from Cont Ops Basic EPS from Cont Ops, Adjusted 5.73 5.73 8.40 7.10 6.30 5.05 5.74 1,666.0 1,578.0 5.69 1,507.0 8.36 Diluted Weighted Avg Shares Diluted EPS, GAAP Diluted EPS from Cont Ops Diluted EPS from Cont Ops, Adjusted 6.64 6.26 8.36 5.69 5.70 7.06 5.02 US GAAP) US GAAP 16,655.0 30.21 14,069.0 13,873.0 17,848.0 30.03 US GAAP 15,997.0 22.98 13,153.0 11,830.0 15,090.0 14,837.0 45.04 44.94 Reference Items Accounting Standard EBITDA EBITDA Margin (T12M) EBITA EBIT Gross Margin Operating Margin Profit Margin Current Profit Sales per Employee Dividends per Share Total Cash Common Dividends Capitalized Interest Expense Depreciation Expense Rental Expense Source: Bloomberg 25.16 16.32 24.96 17.90 39.57 17.00 11.93 - 277,070.35 1.56 295,691.54 1.68 2,518.3 312,139.01 1.76 2,914.6 2.446.1 87.0 2,586.0 125.0 2,758.0 900.0 222.0 2,844.0 1,100.0 900.0 Walt Disney Co/The (DIS US) - Standardized FY 2017 09/30/2017 FY 2018 09/29/2018 FY 2019 09/28/2019 4,017.0 4,017.0 0.0 7.611.0 7.611.0 0.01 4.150.0 4.150.0 0.0 8.288.0 8,288.0 0.0 1,392.0 3.015.0 5.418.0 5.418.0 0.0 12,882.0 12,882.0 0.0 1,649.0 8,175.0 1,373.0 2.888.0 445.0 57.0 59.0 82.0 In Millions of USD except Per Share 12 Months Ending Total Assets Cash Cash Equivalents & STI + Cash & Cash Equivalents + ST Investments + Accounts & Notes Receiv + Accounts Receivable, Net +Notes Receivable, Net + Inventories + Other ST Assets + Prepaid Expenses + Derivative & Hedging Assets +Deferred Tax Assets + Misc ST Assets Total Current Assets + Property, Plant & Equip.Net + Property, Plant & Equip Accumulated Depreciation +LT Investments & Receivables +LT Investments + Other LT Assets + Total Intangible Assets + Goodwill + Other Intangible Assets + Prepaid Expense + Derivative & Hedging Assets + Prepaid Pension Costs + Investments in Affiliates + Misc LT Assets Total Noncurrent Assets Total Assets 2,386.0 15,889.0 28,408.0 57.443.0 29,0370 115.0 2.958.0 16,825.0 29,540.0 80,304.0 30,764.0 131.0 131.0 52,102.0 38,081.0 31,269.0 6,8120 8,093.0 28.1240 31 8030 64,018.0 32.415.0 302.0 302.0 115.0 51,379.0 133.955.0 103,508.0 80,293.0 23.215.0 38,421.0 31,426.0 6.9950 233.0 5.0 70.0 40.0 142.0 113.0 5.0 2.922.0 3.087.0 9,563.0 79,900.0 27,378.0 2,768.0 11.100.0 81,773.0 98,598.0 165,860.0 193,984.0 95,789.0 8,708.0 6,305.0 0.0 17.758.0 13.778.0 9,352.0 6,503.0 0.0 0.0 0.0 2.401.0 6,184.0 0.0 12.0 2.849.0 3,802.0 0.0 0.0 0.0 3.978.0 8,882.0 0.0 5.0 50 12.0 120 120 6.172.0 4.705.0 4,588.0 137.0 3.790.0 4,708.0 4,591.0 115.0 0.0 8.857.0 4.723.0 4.7220 1.0 0.0 0.0 19,595.0 19.248.0 19.119.0 129.0 17,860.0 17 226.0 17.084.0 142.0 31,341.0 38.275.0 38,129,0 148.0 129.0 1420 1460 Liabilities & Shareholders' Equity + Payables & Accruals + Accounts Payable + Accrued Taxes +Interest & Dividends Payable + Other Payables & Access +STDb +ST Borowings +ST Lease Liabilities +ST Finance Leases +ST Operating Leases + Cument Portion of LT Debt + Other ST Liabilities + Deferred Revenue + Derivatives & Hedging + Misc ST Liabilities Total Current Liabilities +LTDb +LT Bomowings +LT Lease Liabilities +LT Finance Leases +LT Operating Leases + Other LT Liabilities + Accrued Liabilities + Pension Liabilities + Pensions + Other Post Ret Benefits + Deferred Revenue +Deferred Tax Liabilities Derivatives & Hedging + Misc LT Liabilities Total Noncurrent Liabilities Total Liabilities Preferred Equity and Hybrid Capital + Share Capital & APIC + Common Stock + Additional Paid in Capital - Treasury Stock +Retained Earnings Other Equity Equity Before Minority Interest + Minority Non Controlling interest Total Equity Total Liabilities & Equity 9,557.0 0.0 21,516.0 0.0 4.783.0 10.794.0 0.0 3.281.0 2.231.0 1,050.0 0.0 4.480.0 2,712.0 1,834.0 8780 0.0 3.109.0 44.0 3,604.0 1,179.0 0.0 7,902.0 57.0 8.774.0 61.0 2,972.0 30.042.0 49,637,0 59,791.0 91,132.0 0.0 53,9070 0.0 3.692.0 26,783.0 44.643.0 0.0 38,779.0 28.9 38,750.1 67,588.0 82,679.0 3.0970 18.0 38.248.0 292 38.218.8 64,011.0 72,608.0 3,528.0 41,315.0 4,8370 46, 152.0 95,789.0 53,889.0 907.0 42.494.0 6,617.0 88,877.0 13,975.0 48,773.0 5.182.0 53,955.0 98,598.0 102,852.0 193,9840 US GAAP 1.488.0 1.400.0 Reference Items Accounting Standard Shares Outstanding Number of Treasury Shares Pension Obligations Future Minimum Operating Lease Obligations Capital Leases. Total Options Granted During Period Options Outstanding at Period End Net Debt Net Debt to Equity Tangible Common Equity Ratio Current Ratio Cash Conversion Cycle Number of Employees Source: Bloomberg US GAAP 1,517.0 1.400.0 3.281.0 3.3480 141.0 5.0 24.0 21.415.0 48.40 2,712.0 3,584.0 154.0 4.0 24.0 16,878.0 31.28 17.67 0.94 -7.19 US GAAP 1.783.0 19.0 4.783.0 5,931.0 151.0 4.0 23.0 41,719.0 40.56 -16.17 0.90 5.04 0.81 -18.76 223,000.00 199,000.00 201,000.00 FY 2019 The Walt Disney Company Peer Comparison Ratios FY 2019 DIS Equity CBS Equity Disney CBS CUR RATIO QUICK RATIO ACCT RCV DAYS INVENT TURN Liquidity Current Ratio Quick Ratio Days Sales Outstanding Days of Inventory 1.32 0.87 94.52 60.00 ASSET TURNOVER Performance Asset Turnover Ratio Operating Return on Assets 0.59 0.07 TOT DEBT TO TOT ASSET INTEREST COVERAGE RATIO Debt Debt to Asset Ratio Interest Coverage Ratio 0.42 4.44 Return Return on Equity RETURN_COM_EQY 0.28
Step by Step Solution
There are 3 Steps involved in it

Get step-by-step solutions from verified subject matter experts