

Question: 1 please graph it using excel Price Quantity Demanded Quantity Supplied 100 100 500 850 200 500 700 300 450 550 400 400 400 500
1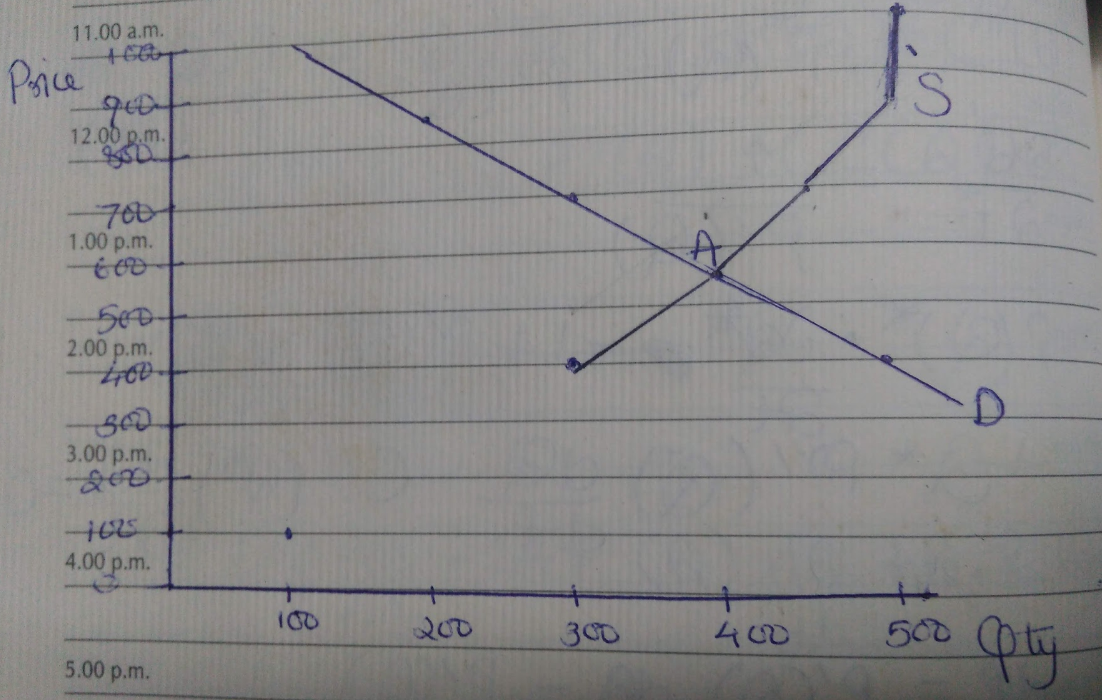 please graph it using excel
| Price | Quantity Demanded | Quantity Supplied |
| 100 | 100 | 500 |
| 850 | 200 | 500 |
| 700 | 300 | 450 |
| 550 | 400 | 400 |
| 400 | 500 | 300 |
Step by Step Solution
There are 3 Steps involved in it
1 Expert Approved Answer
Step: 1 Unlock

Question Has Been Solved by an Expert!
Get step-by-step solutions from verified subject matter experts
Step: 2 Unlock
Step: 3 Unlock