

Question: 1) Plot the data and describe what you see. What does it mean and how would you use the information from the plot to help
1) Plot the data and describe what you see. What does it mean and how would you use the information from the plot to help you develop a forecast?
2) Use at least two different methodologies to develop as accurate a forecast as possible for the demand. Use each of those methods to project the next four months' demand.
3) Which method from question 2 is better? How do you know that?
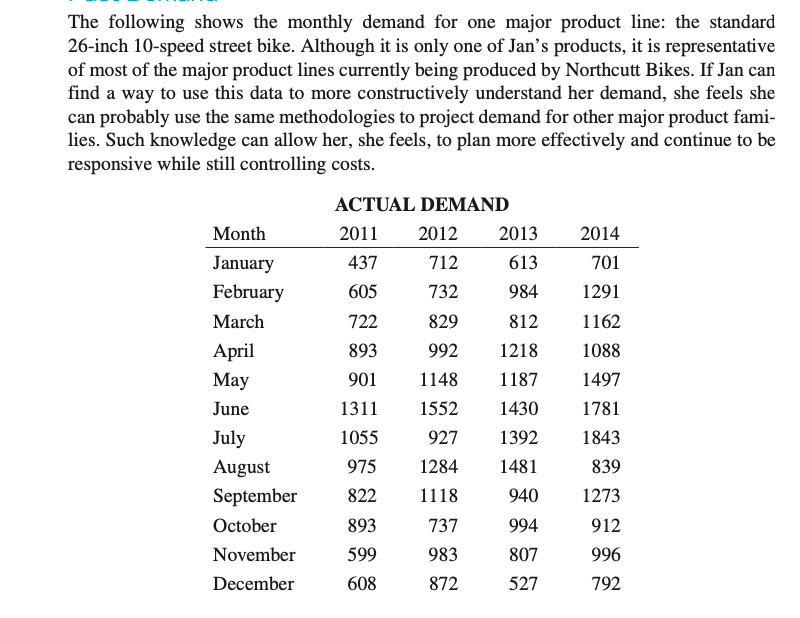
The following shows the monthly demand for one major product line: the standard 26-inch 10-speed street bike. Although it is only one of Jan's products, it is representative of most of the major product lines currently being produced by Northcutt Bikes. If Jan can find a way to use this data to more constructively understand her demand, she feels she can probably use the same methodologies to project demand for other major product families. Such knowledge can allow her, she feels, to plan more effectively and continue to be responsive while still controlling costs
Step by Step Solution
There are 3 Steps involved in it

Get step-by-step solutions from verified subject matter experts