

Question: 1. Plot x(t) and h(t). 2. Write a MATLAB code to calculate y(t) in an acceptable range of t. 3. plot y(t). 4. Calculate the
 1. Plot x(t) and h(t).
2. Write a MATLAB code to calculate y(t) in an acceptable range of t.
3. plot y(t).
4. Calculate the function y(t) manually.
5. Compare your MATLAB results with your calculation.
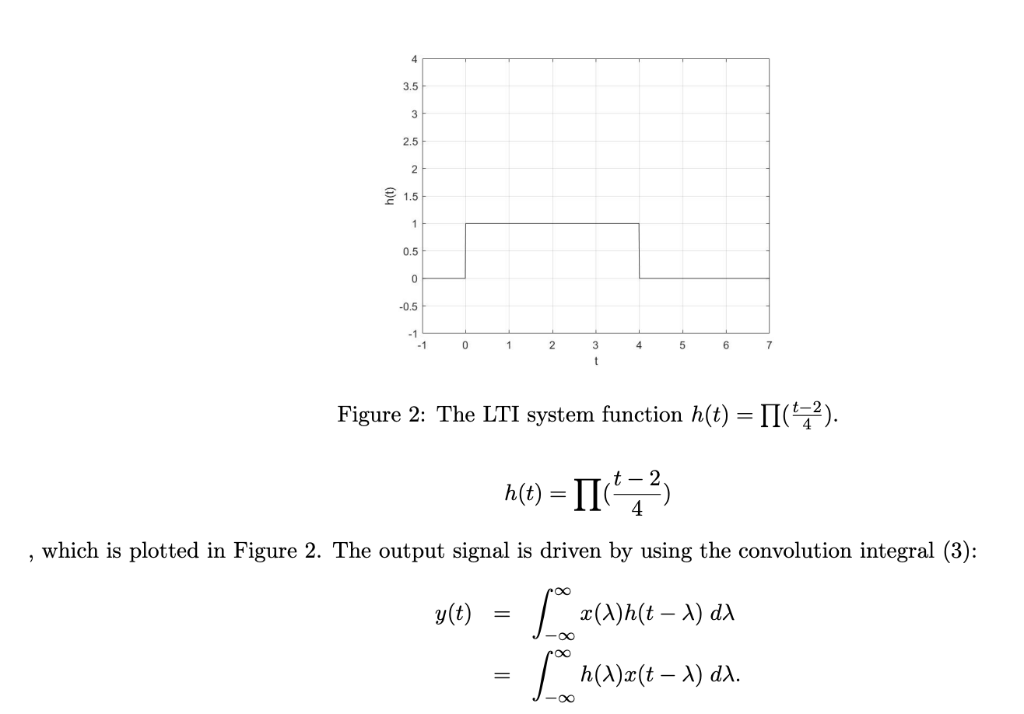
3.5 2.5 1.5 0.5 0.5 Figure 2: The LTI system function h(t) - II2 h(t)-11( 2) , which is plotted in Figure 2. The output signal is driven by using the convolution integral (3): oO h(X)x(t - X) dX
Step by Step Solution
There are 3 Steps involved in it
1 Expert Approved Answer
Step: 1 Unlock

Question Has Been Solved by an Expert!
Get step-by-step solutions from verified subject matter experts
Step: 2 Unlock
Step: 3 Unlock