

Question: 1 point 3. Which feature of dynamic equilibrium does the graph below illustrate once equilibrium is reached? (1 K/U) Concentration Time (s) The concentration of
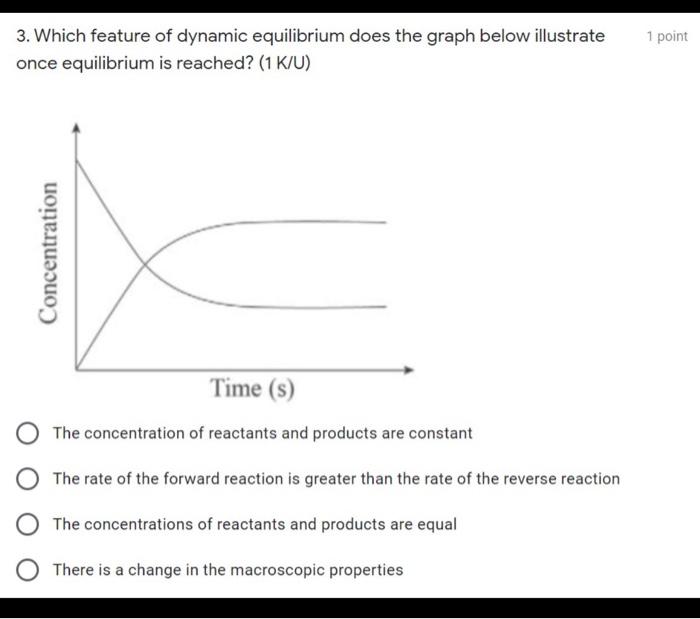
1 point 3. Which feature of dynamic equilibrium does the graph below illustrate once equilibrium is reached? (1 K/U) Concentration Time (s) The concentration of reactants and products are constant The rate of the forward reaction is greater than the rate of the reverse reaction The concentrations of reactants and products are equal O There is a change in the macroscopic properties
Step by Step Solution
There are 3 Steps involved in it
1 Expert Approved Answer
Step: 1 Unlock

Question Has Been Solved by an Expert!
Get step-by-step solutions from verified subject matter experts
Step: 2 Unlock
Step: 3 Unlock