

Question: can someone help me with this lab please LAB #3 - Chemistry 30 Part D- Equilibriums Equilibrium Concepts - An Introduction If equilibrium is to
can someone help me with this lab please
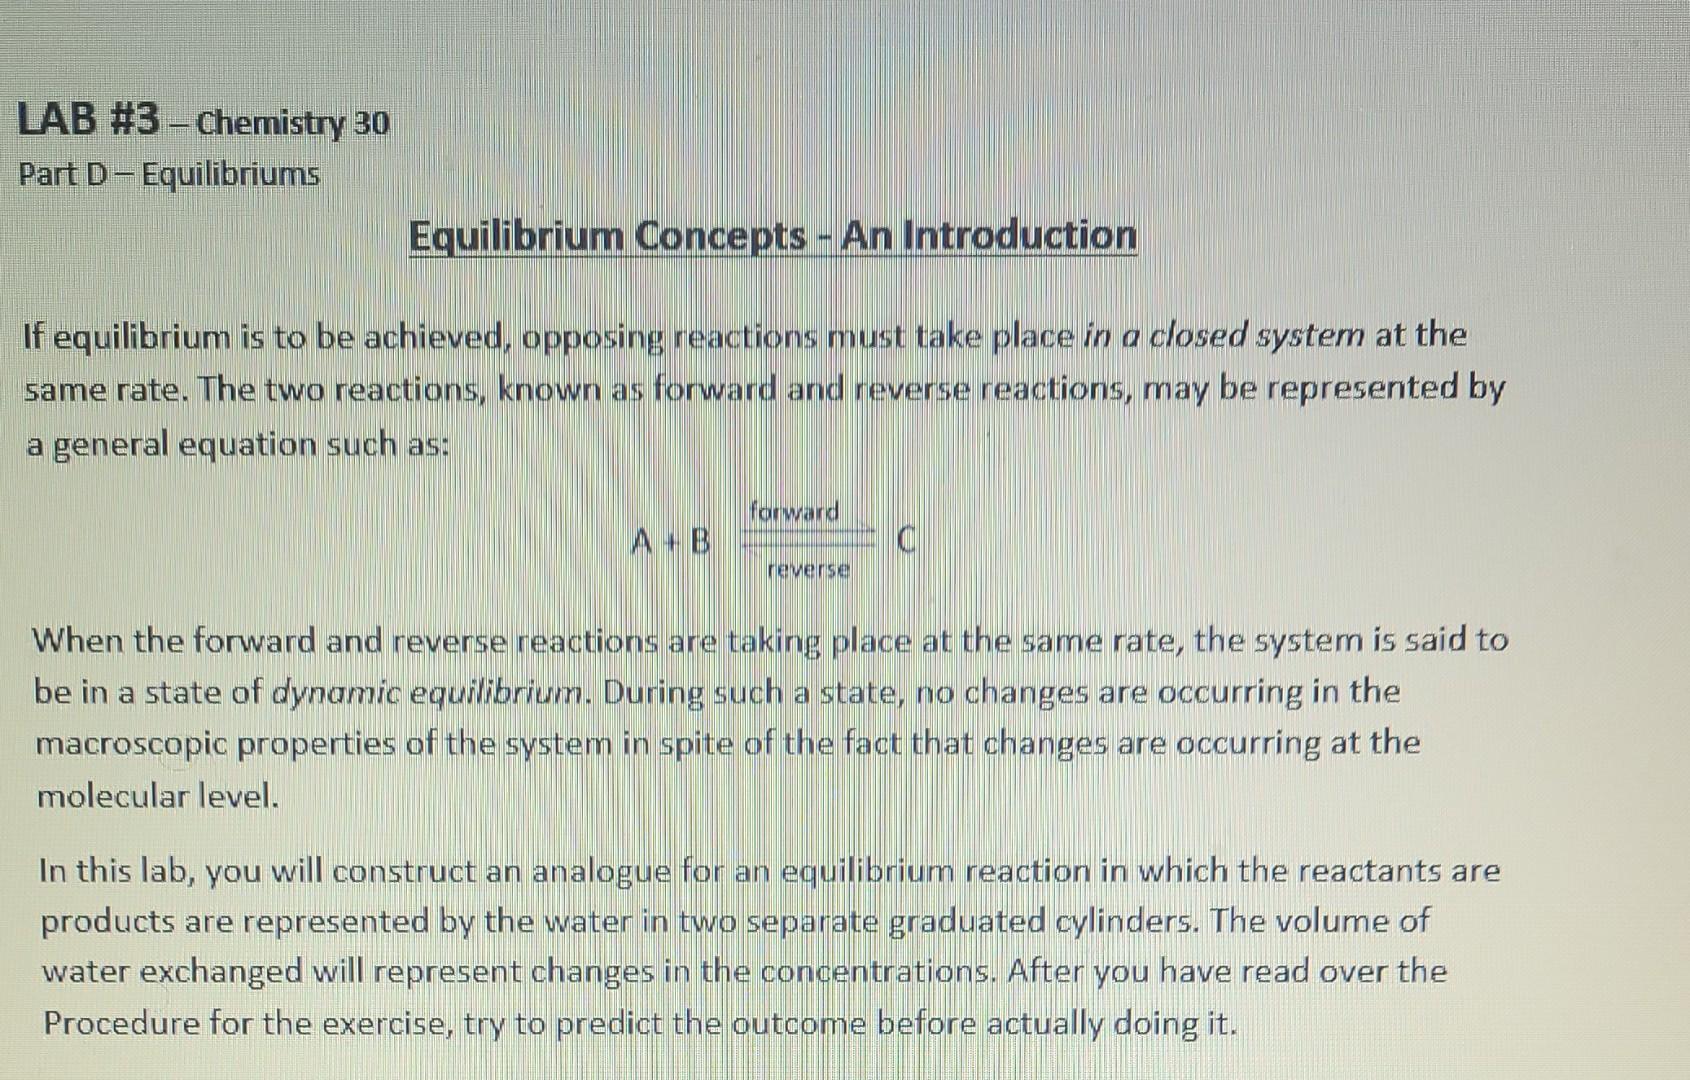
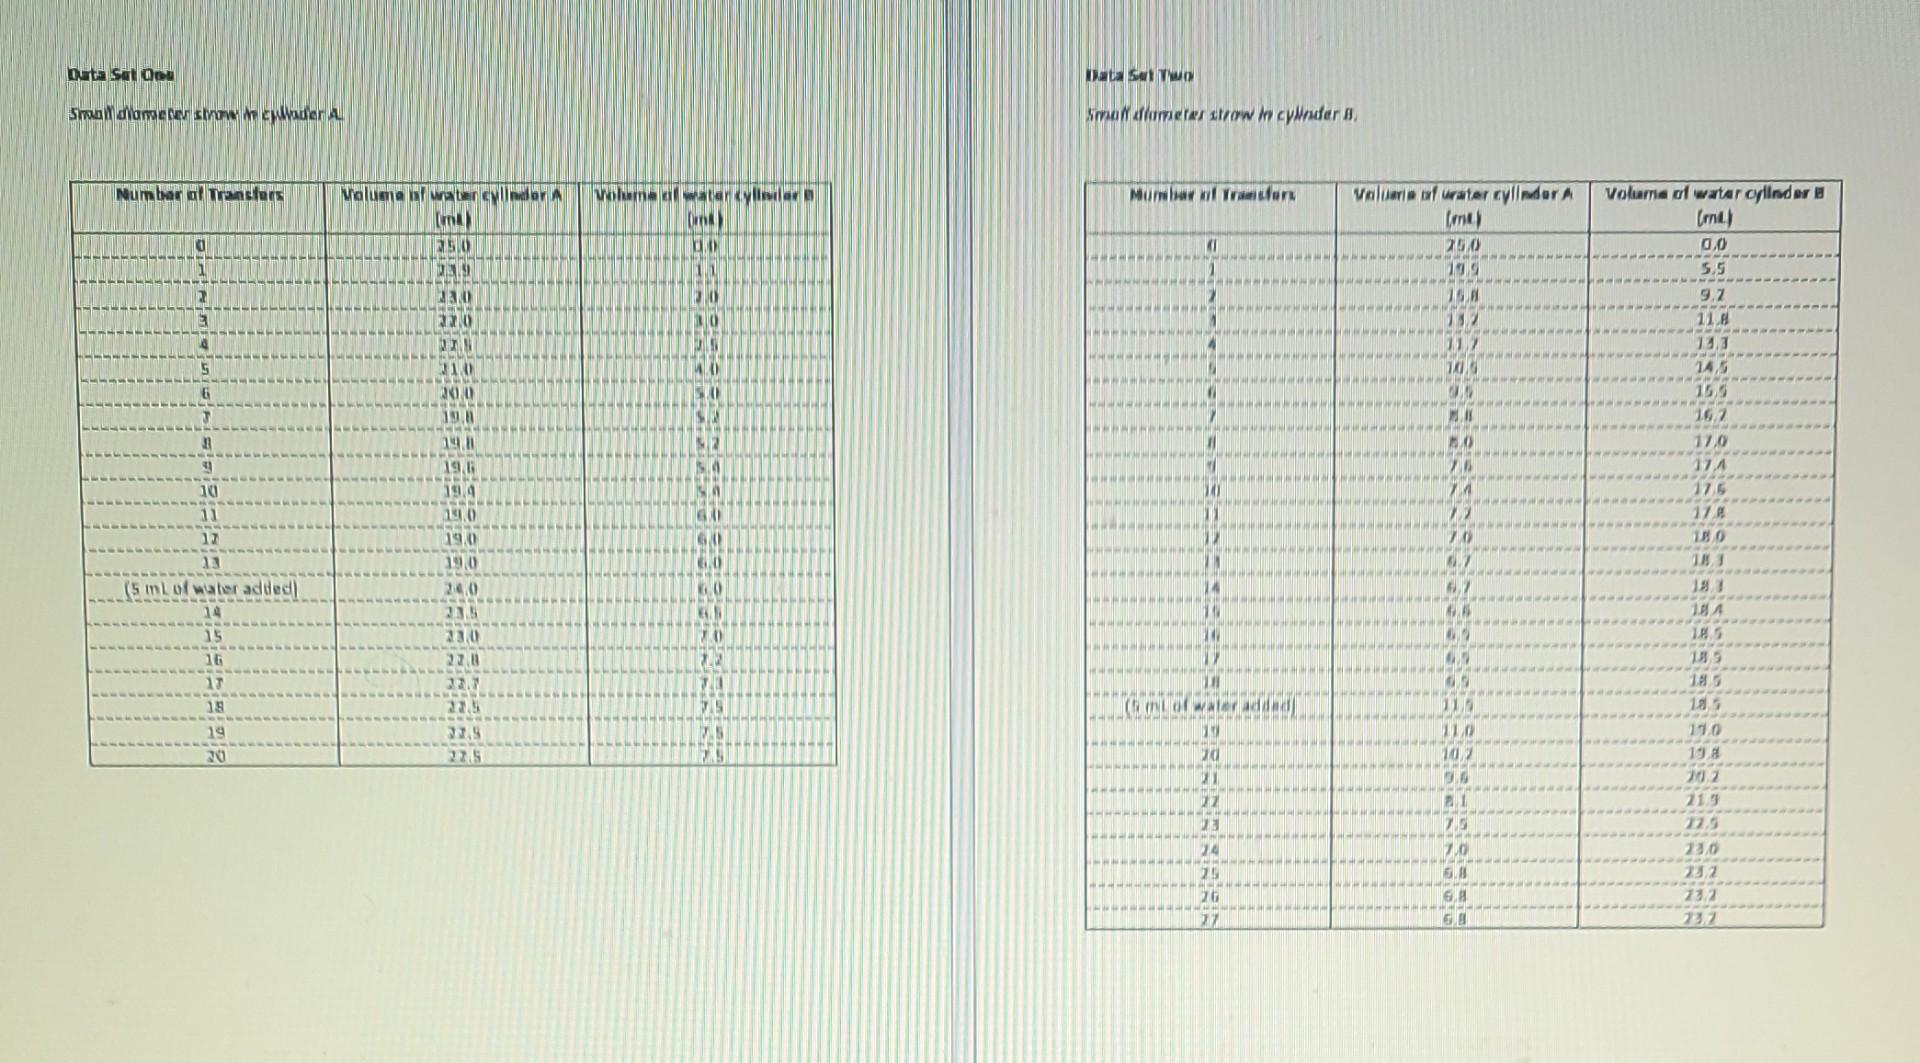
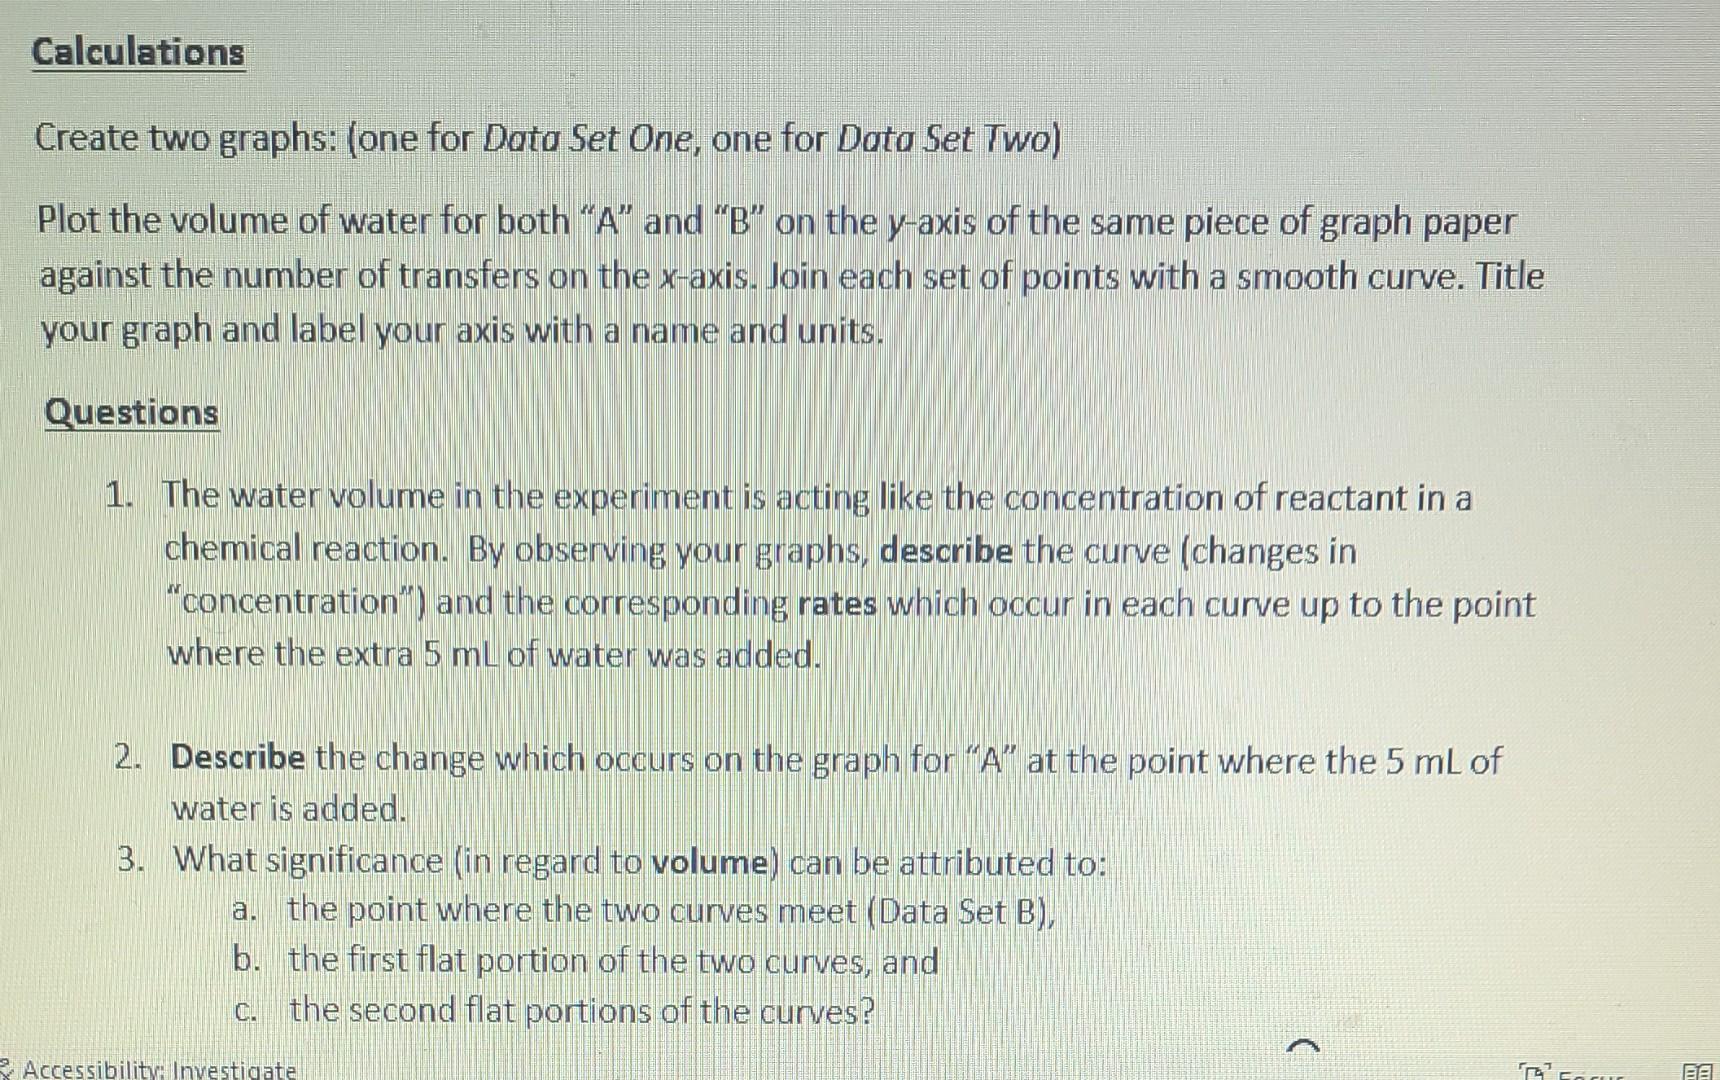
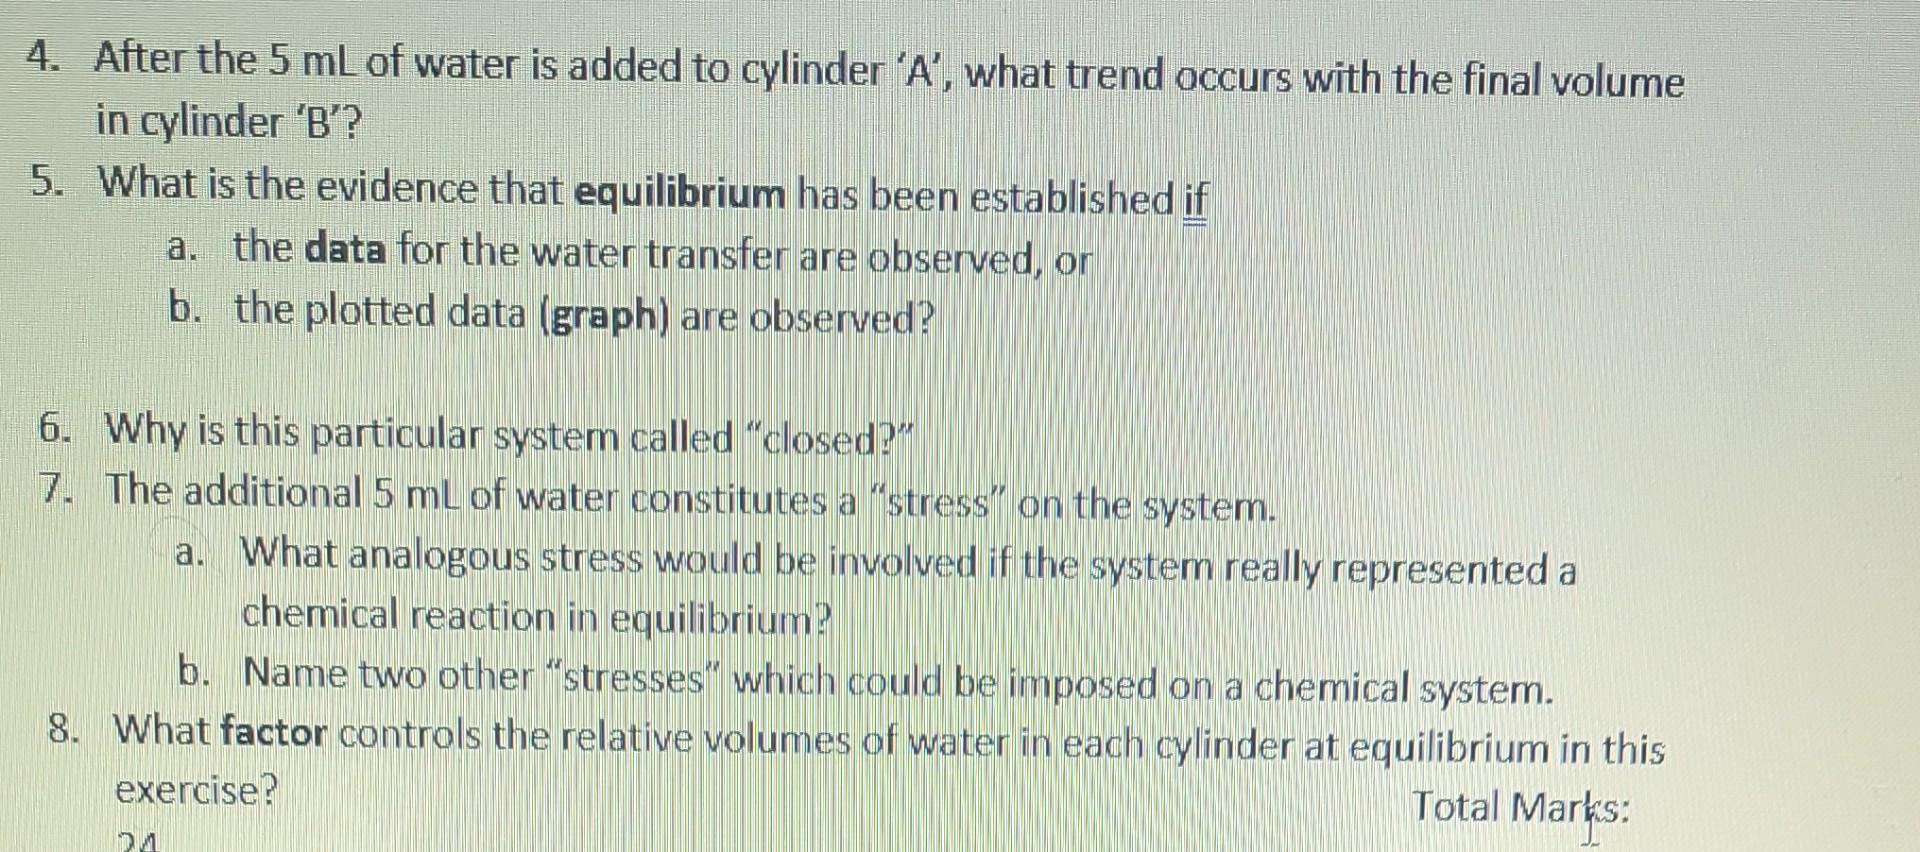
LAB #3 - Chemistry 30 Part D- Equilibriums Equilibrium Concepts - An Introduction If equilibrium is to be achieved, opposing reactions must take place in a closed system at the same rate. The two reactions, known as forward and reverse reactions, may be represented by a general equation such as: forward AB C reverse When the forward and reverse reactions are taking place at the same rate, the system is said to be in a state of dynamic equilibrium. During such a state, no changes are occurring in the macroscopic properties of the system in spite of the fact that changes are occurring at the molecular level. In this lab, you will construct an analogue for an equilibrium reaction in which the reactants are products are represented by the water in two separate graduated cylinders. The volume of water exchanged will represent changes in the concentrations. After you have read over the Procedure for the exercise, try to predict the outcome before actually doing it. buta sa 00 OMAINS Show cometen sowWider Na dlometer strow in cylinder B Numbar al transfers Munawwl Tronx Maluma at watercolor (un) 250 volume materiale UNA valueria ufurater cylinder A (me) 200 D D 1 BEM 11 DER 20 2 220 15. REMA 232 112 HANH HOME 4 SDL WWW Volume of water cylinder B (mt) 0.0 5.5 9.2 11.8 13,3 145 153 167 17,0 17.4 175 178 180 INT 0 HA --- WILL 29 12 9161 25 DE 11 12 13 GA GAI 0 0 19.4 19.0 19.0 19/0 240 23.5 2010 22.0 (5 Ipappe 09 0 184 185 10 insin 22 TU 185 09 11 75 (Gm of water and 15 19 20 75 15 110 198 225 DE 10% ZOO 22 TE EC 25 20 21.9 12.5 23.0 23.2 23.2 232 24 25 20 22 BE BE 6 6. 33 Calculations Create two graphs: (one for Data Set One, one for Data Set Two) Plot the volume of water for both "A" and "B" on the y-axis of the same piece of graph paper against the number of transfers on the x-axis. Join each set of points with a smooth curve. Title your graph and label your axis with a name and units. a Questions 1. The water volume in the experiment is acting like the concentration of reactant in a chemical reaction. By observing your graphs, describe the curve (changes in "concentration") and the corresponding rates which occur in each curve up to the point where the extra 5 mL of water was added. 2. Describe the change which occurs on the graph for "A" at the point where the 5 mL of water is added. 3. What significance (in regard to volume) can be attributed to: the point where the two curves meet (Data Set B), b. the first flat portion of the two curves, and C. the second flat portions of the curves? ) Accessibility: Investigate 17 EE 4. After the 5 mL of water is added to cylinder 'A', what trend occurs with the final volume in cylinder 'B'? 5. What is the evidence that equilibrium has been established if a. the data for the water transfer are observed, or b. the plotted data (graph) are observed? 6. Why is this particular system called "closed?" 7. The additional 5 mL of water constitutes a "stress' on the system. a. What analogous stress would be involved if the system really represented a chemical reaction in equilibrium? b. Name two other "stresses" which could be imposed on a chemical system. 8. What factor controls the relative volumes of water in each cylinder at equilibrium in this exercise? Total Marks: : nu LAB #3 - Chemistry 30 Part D- Equilibriums Equilibrium Concepts - An Introduction If equilibrium is to be achieved, opposing reactions must take place in a closed system at the same rate. The two reactions, known as forward and reverse reactions, may be represented by a general equation such as: forward AB C reverse When the forward and reverse reactions are taking place at the same rate, the system is said to be in a state of dynamic equilibrium. During such a state, no changes are occurring in the macroscopic properties of the system in spite of the fact that changes are occurring at the molecular level. In this lab, you will construct an analogue for an equilibrium reaction in which the reactants are products are represented by the water in two separate graduated cylinders. The volume of water exchanged will represent changes in the concentrations. After you have read over the Procedure for the exercise, try to predict the outcome before actually doing it. buta sa 00 OMAINS Show cometen sowWider Na dlometer strow in cylinder B Numbar al transfers Munawwl Tronx Maluma at watercolor (un) 250 volume materiale UNA valueria ufurater cylinder A (me) 200 D D 1 BEM 11 DER 20 2 220 15. REMA 232 112 HANH HOME 4 SDL WWW Volume of water cylinder B (mt) 0.0 5.5 9.2 11.8 13,3 145 153 167 17,0 17.4 175 178 180 INT 0 HA --- WILL 29 12 9161 25 DE 11 12 13 GA GAI 0 0 19.4 19.0 19.0 19/0 240 23.5 2010 22.0 (5 Ipappe 09 0 184 185 10 insin 22 TU 185 09 11 75 (Gm of water and 15 19 20 75 15 110 198 225 DE 10% ZOO 22 TE EC 25 20 21.9 12.5 23.0 23.2 23.2 232 24 25 20 22 BE BE 6 6. 33 Calculations Create two graphs: (one for Data Set One, one for Data Set Two) Plot the volume of water for both "A" and "B" on the y-axis of the same piece of graph paper against the number of transfers on the x-axis. Join each set of points with a smooth curve. Title your graph and label your axis with a name and units. a Questions 1. The water volume in the experiment is acting like the concentration of reactant in a chemical reaction. By observing your graphs, describe the curve (changes in "concentration") and the corresponding rates which occur in each curve up to the point where the extra 5 mL of water was added. 2. Describe the change which occurs on the graph for "A" at the point where the 5 mL of water is added. 3. What significance (in regard to volume) can be attributed to: the point where the two curves meet (Data Set B), b. the first flat portion of the two curves, and C. the second flat portions of the curves? ) Accessibility: Investigate 17 EE 4. After the 5 mL of water is added to cylinder 'A', what trend occurs with the final volume in cylinder 'B'? 5. What is the evidence that equilibrium has been established if a. the data for the water transfer are observed, or b. the plotted data (graph) are observed? 6. Why is this particular system called "closed?" 7. The additional 5 mL of water constitutes a "stress' on the system. a. What analogous stress would be involved if the system really represented a chemical reaction in equilibrium? b. Name two other "stresses" which could be imposed on a chemical system. 8. What factor controls the relative volumes of water in each cylinder at equilibrium in this exercise? Total Marks: : nu
Step by Step Solution
There are 3 Steps involved in it

Get step-by-step solutions from verified subject matter experts