

Question: (1 point) a) The rectangles in the graph below illustrate a ? The value of this Riemann sum is b) The rectangles in the
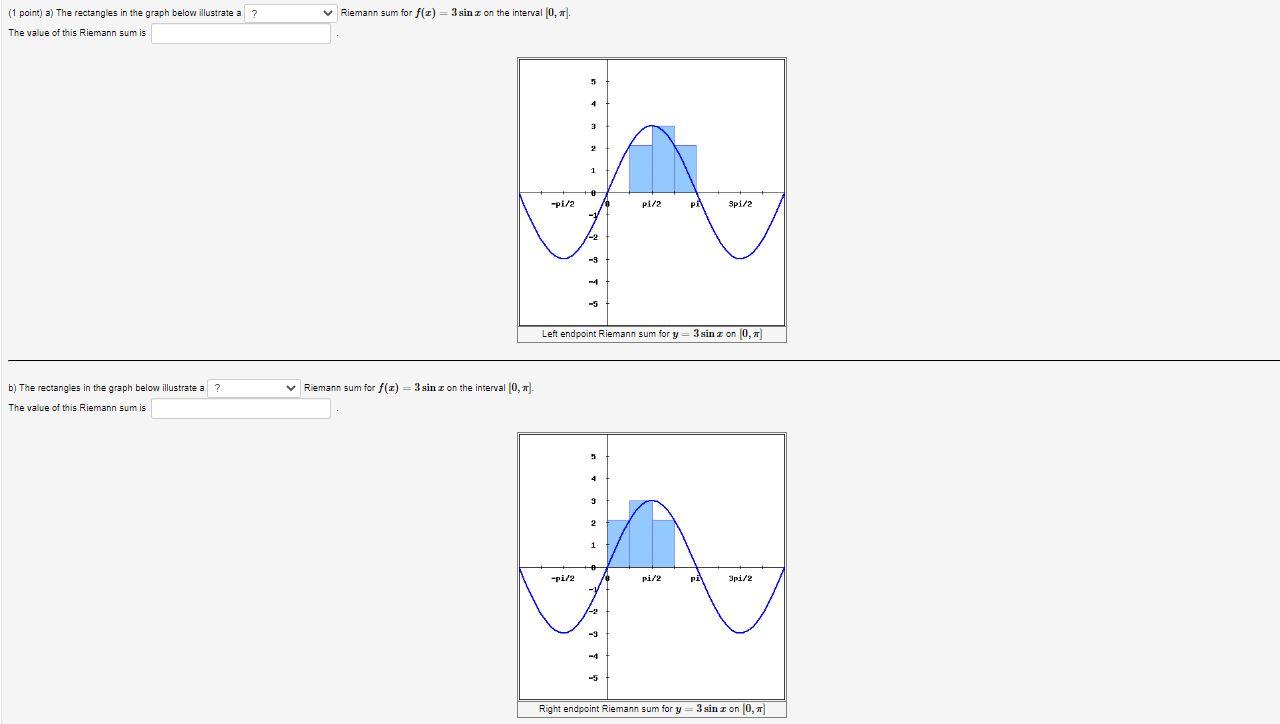
(1 point) a) The rectangles in the graph below illustrate a ? The value of this Riemann sum is b) The rectangles in the graph below illustrate a ? The value of this Riemann sum is Riemann sum for f(x) = 3 sin z on the interval [0, . Riemann sum for f(x) = 3 sin z on the interval [0, T- -pi/2 5 -pi/2 4 3 2 1 +0 1-2 -3 -5 5 Left endpoint Riemann sum for y = 3 sin z on [0, ] 4 3 2 1 pi/2 -3 P pi/2 Spi/2 pi 3pi/2 Right endpoint Riemann sum for y = 3 sin z on [0, 1]
Step by Step Solution
3.49 Rating (156 Votes )
There are 3 Steps involved in it
Sal a So fx 3 Sinn Here ... View full answer

Get step-by-step solutions from verified subject matter experts