

Question: (1 point) From the stem-and-leaf plot below, determine the mean, median and mode(s) of the data. Record answers that are not integers to two decimal
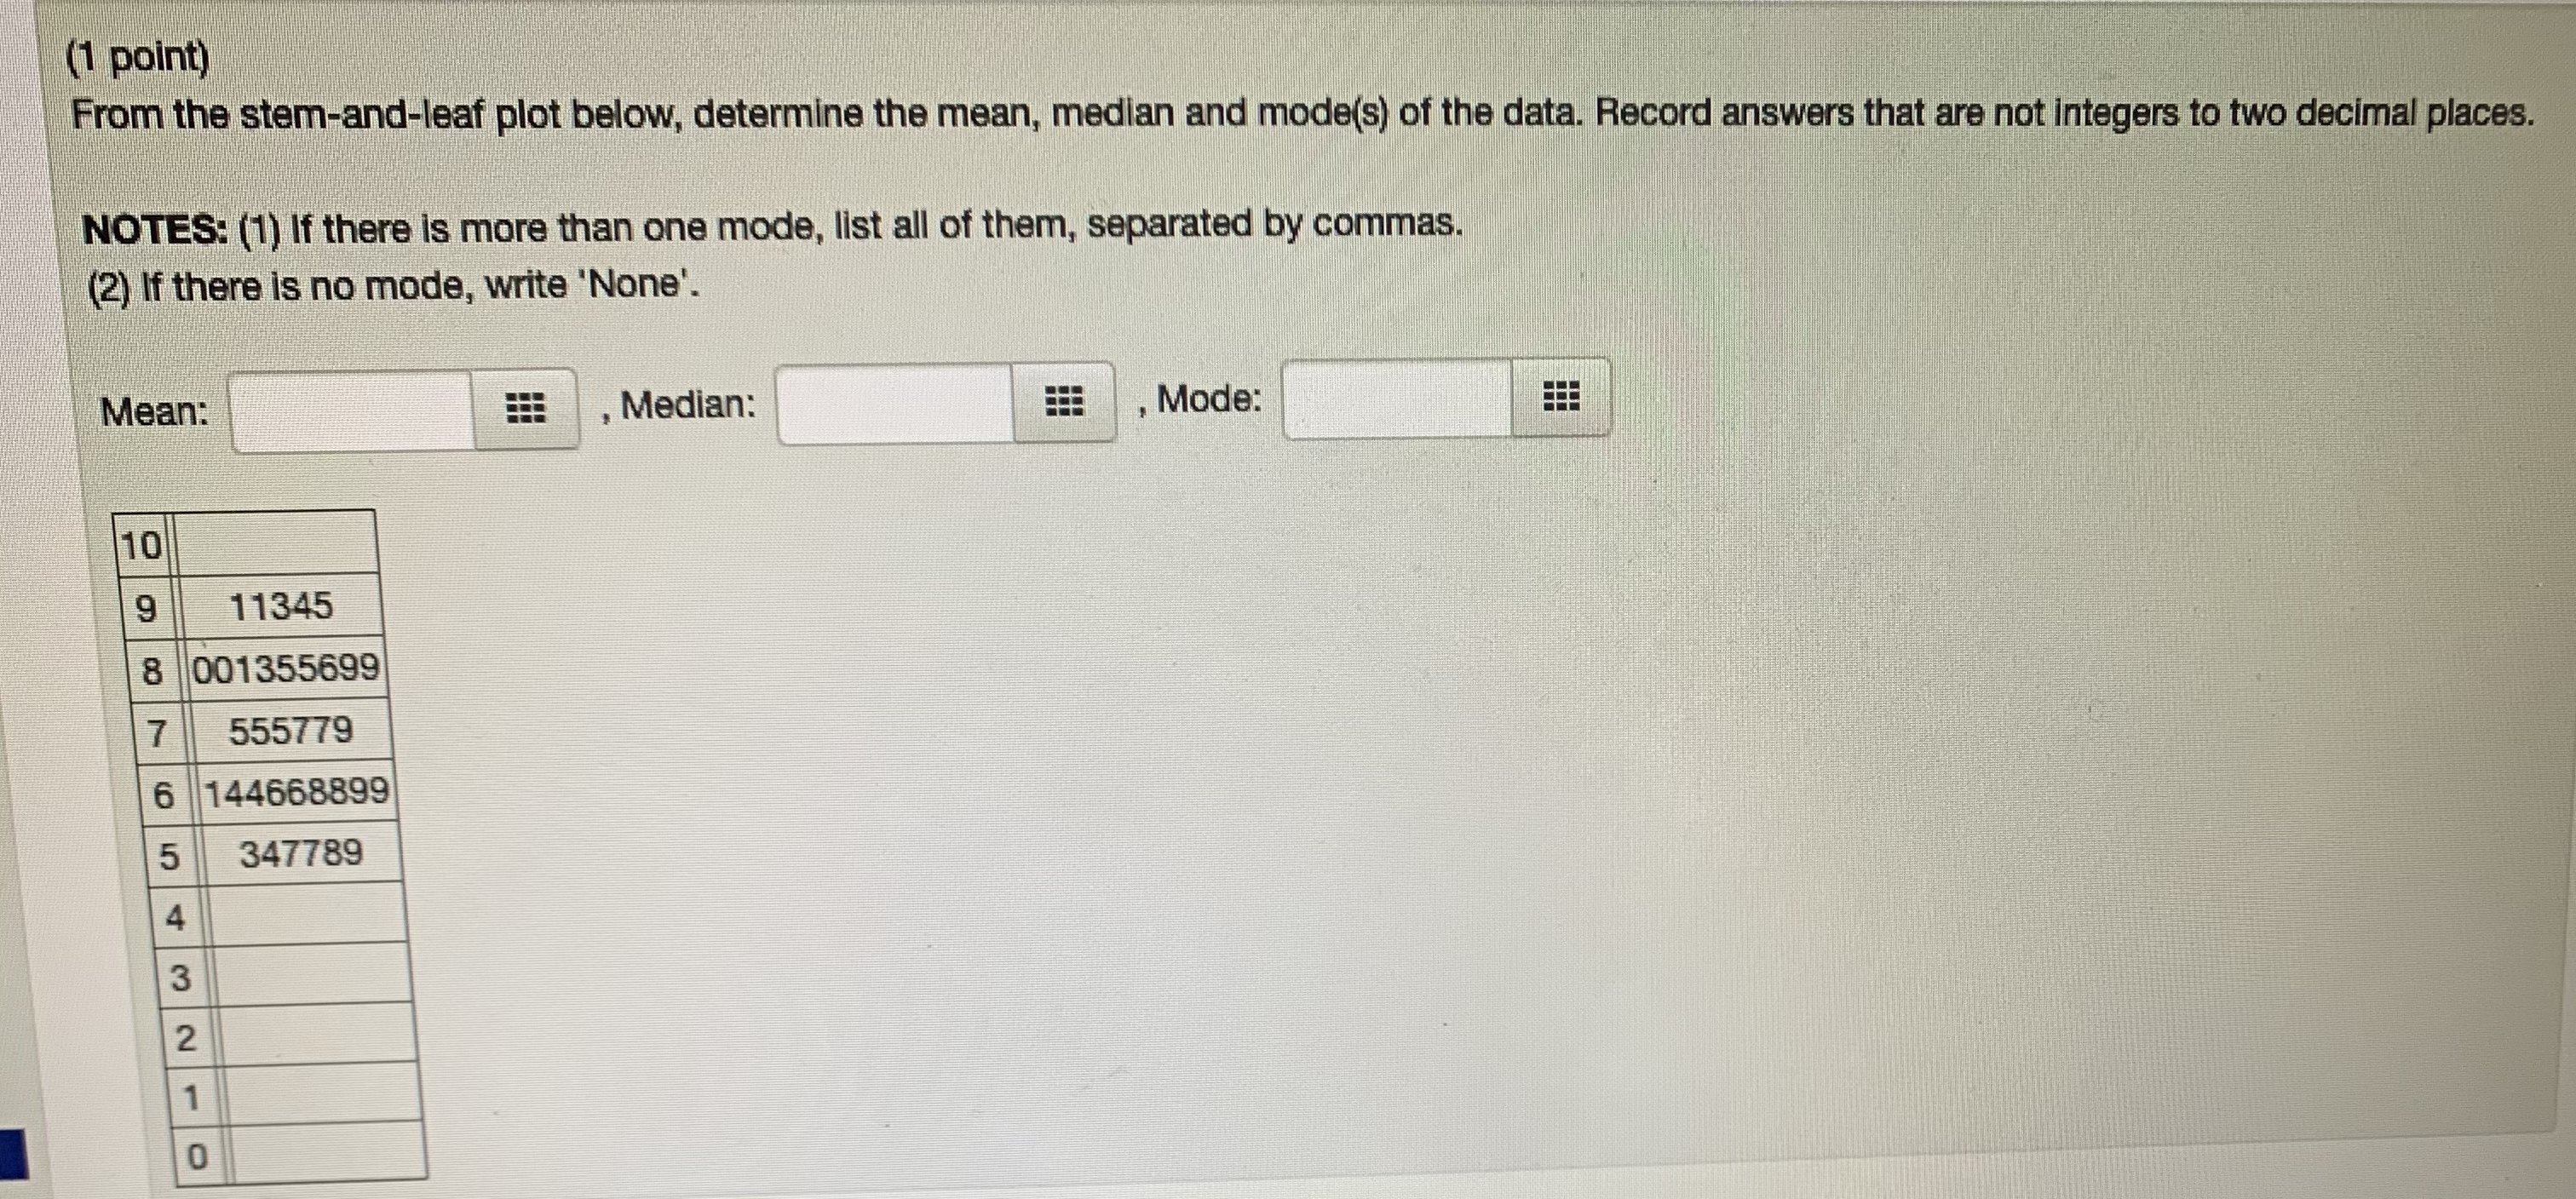
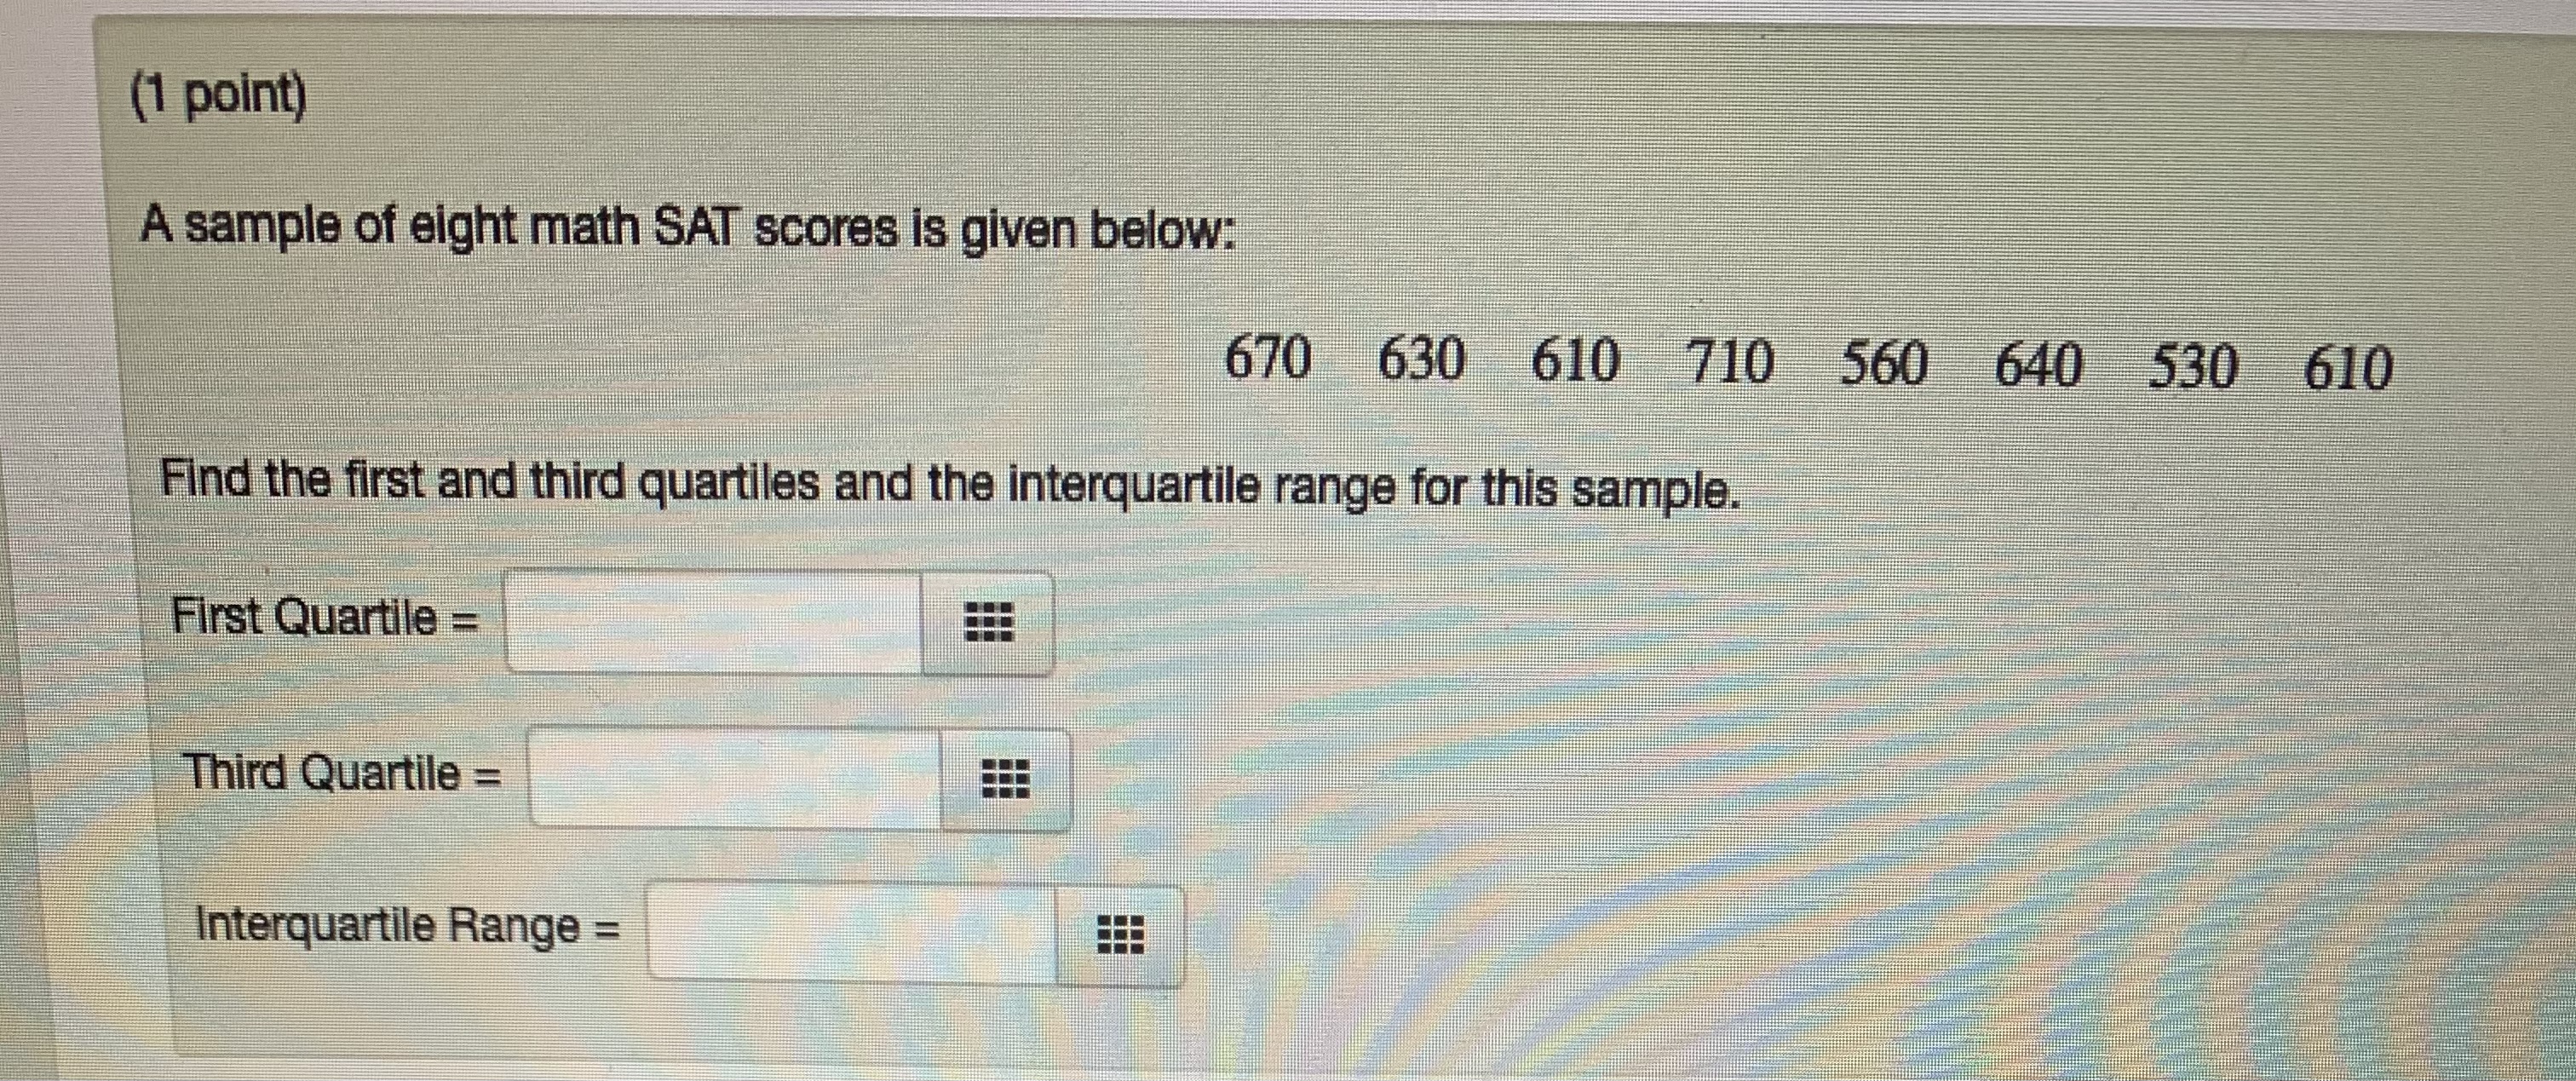
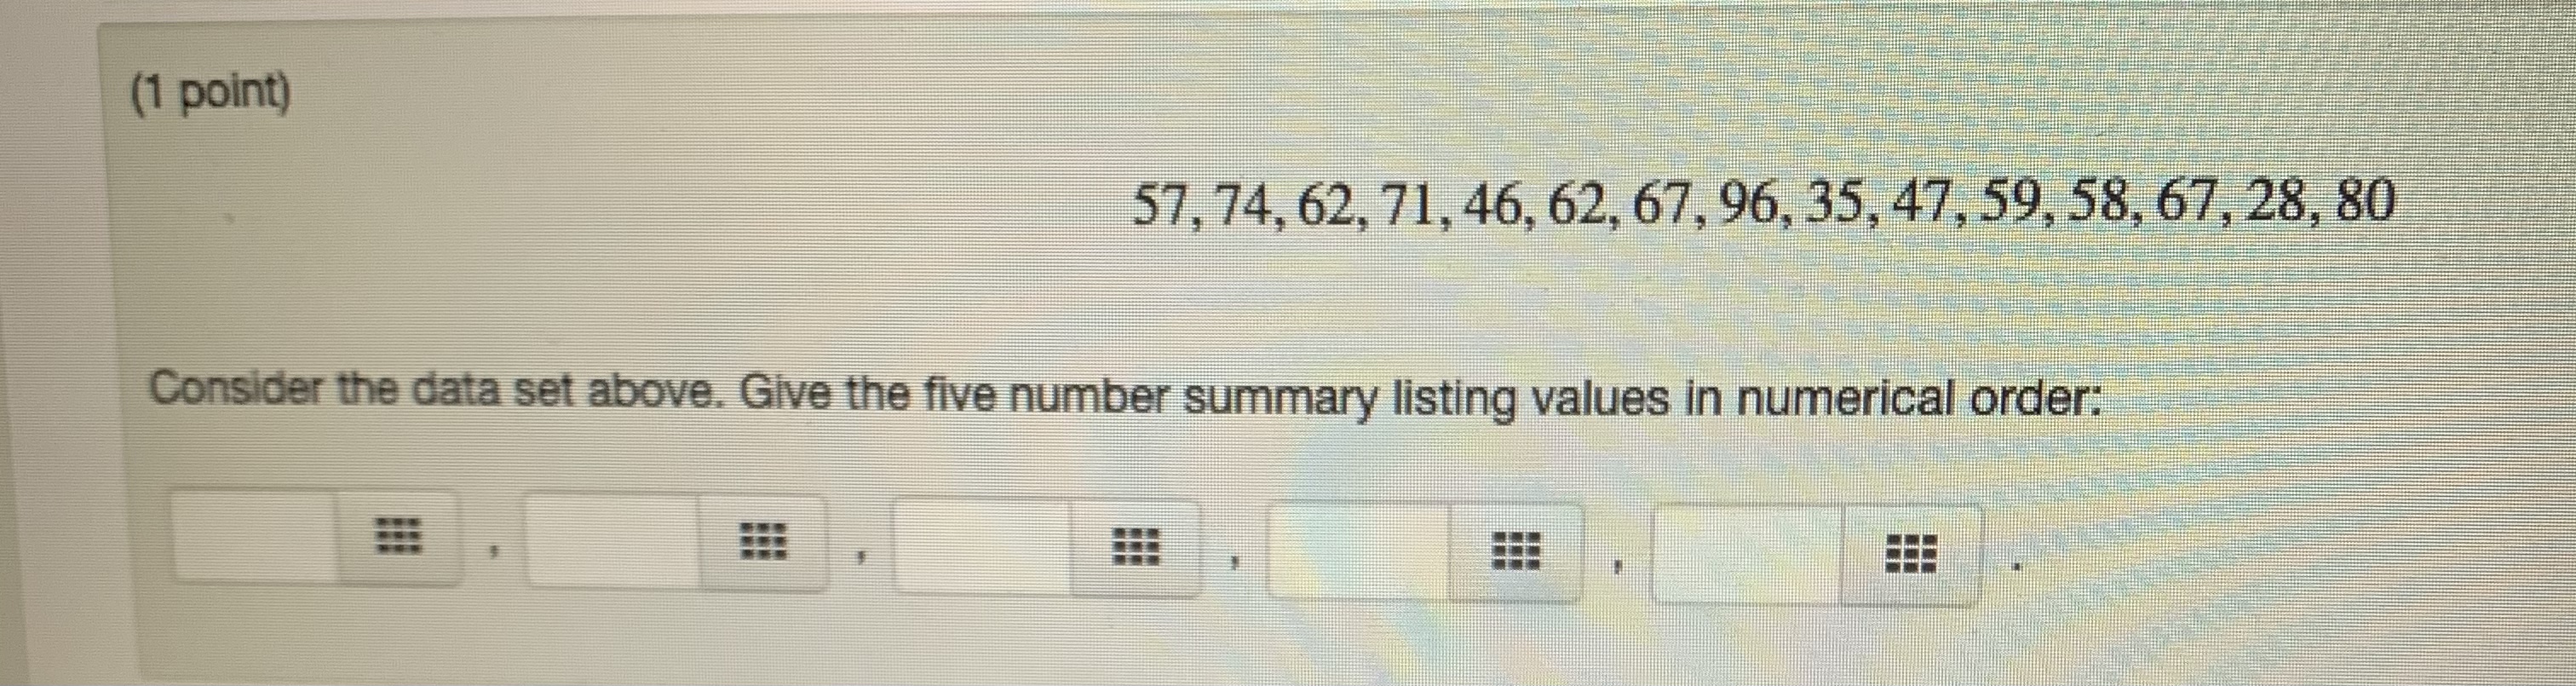
(1 point) From the stem-and-leaf plot below, determine the mean, median and mode(s) of the data. Record answers that are not integers to two decimal places. NOTES: (1) If there is more than one mode, list all of them, separated by commas. (2) If there is no mode, write 'None'. Mean: , Median: Mode: 10 9 1 1345 8 001355699 7 555779 6 144668899 5 347789 4 3 2 0(1 point) A sample of eight math SAT scores is given below: 670 630 610 710 560 640 530 610 Find the first and third quartiles and the interquartile range for this sample. First Quartile = Third Quartile = Interquartile Range =(1 point) 57, 74, 62, 71, 46, 62, 67, 96, 35, 47, 59, 58, 67, 28, 80 Consider the data set above. Give the five number summary listing values in numerical order
Step by Step Solution
There are 3 Steps involved in it

Get step-by-step solutions from verified subject matter experts