

Question: (1 point) From the stem-and-leaf plot below, determine the mean, median and mode(s) of the data. Record answers that are not integers to two decimal
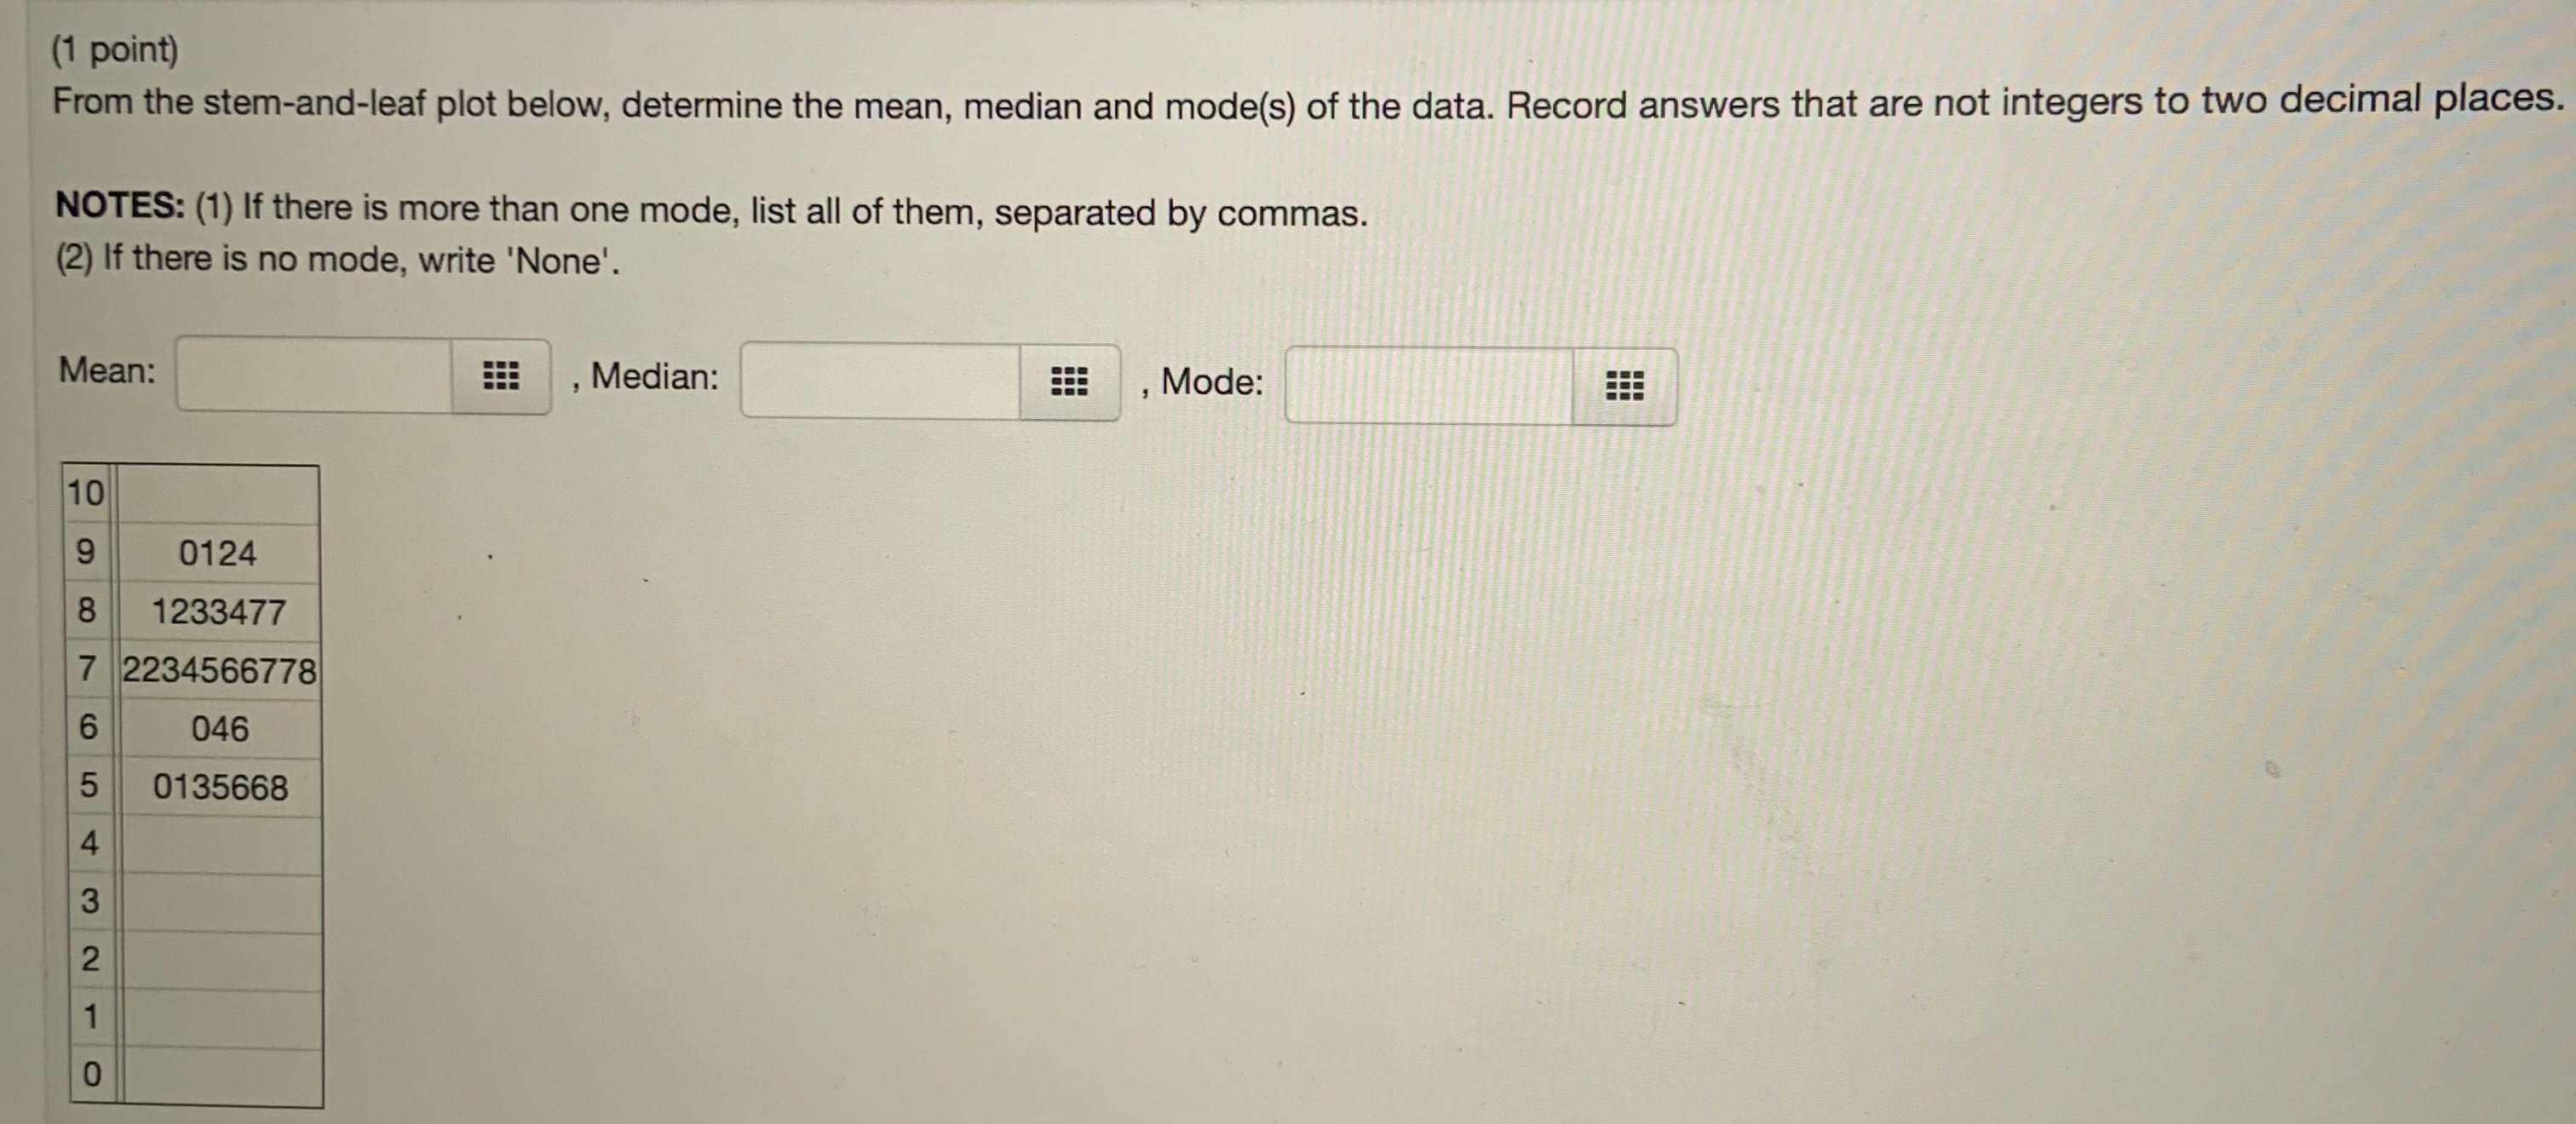
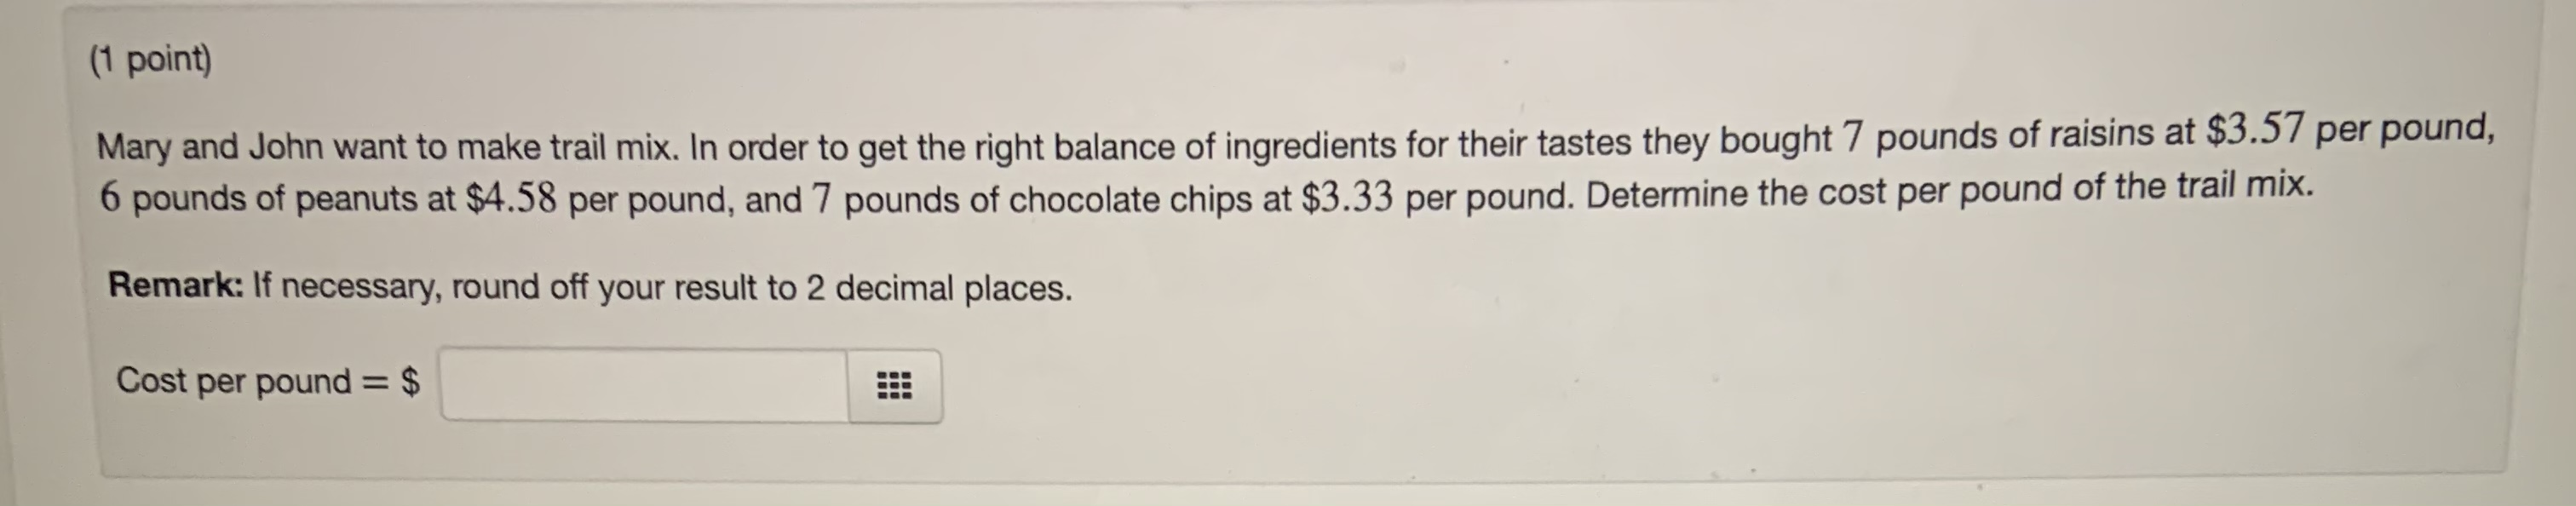
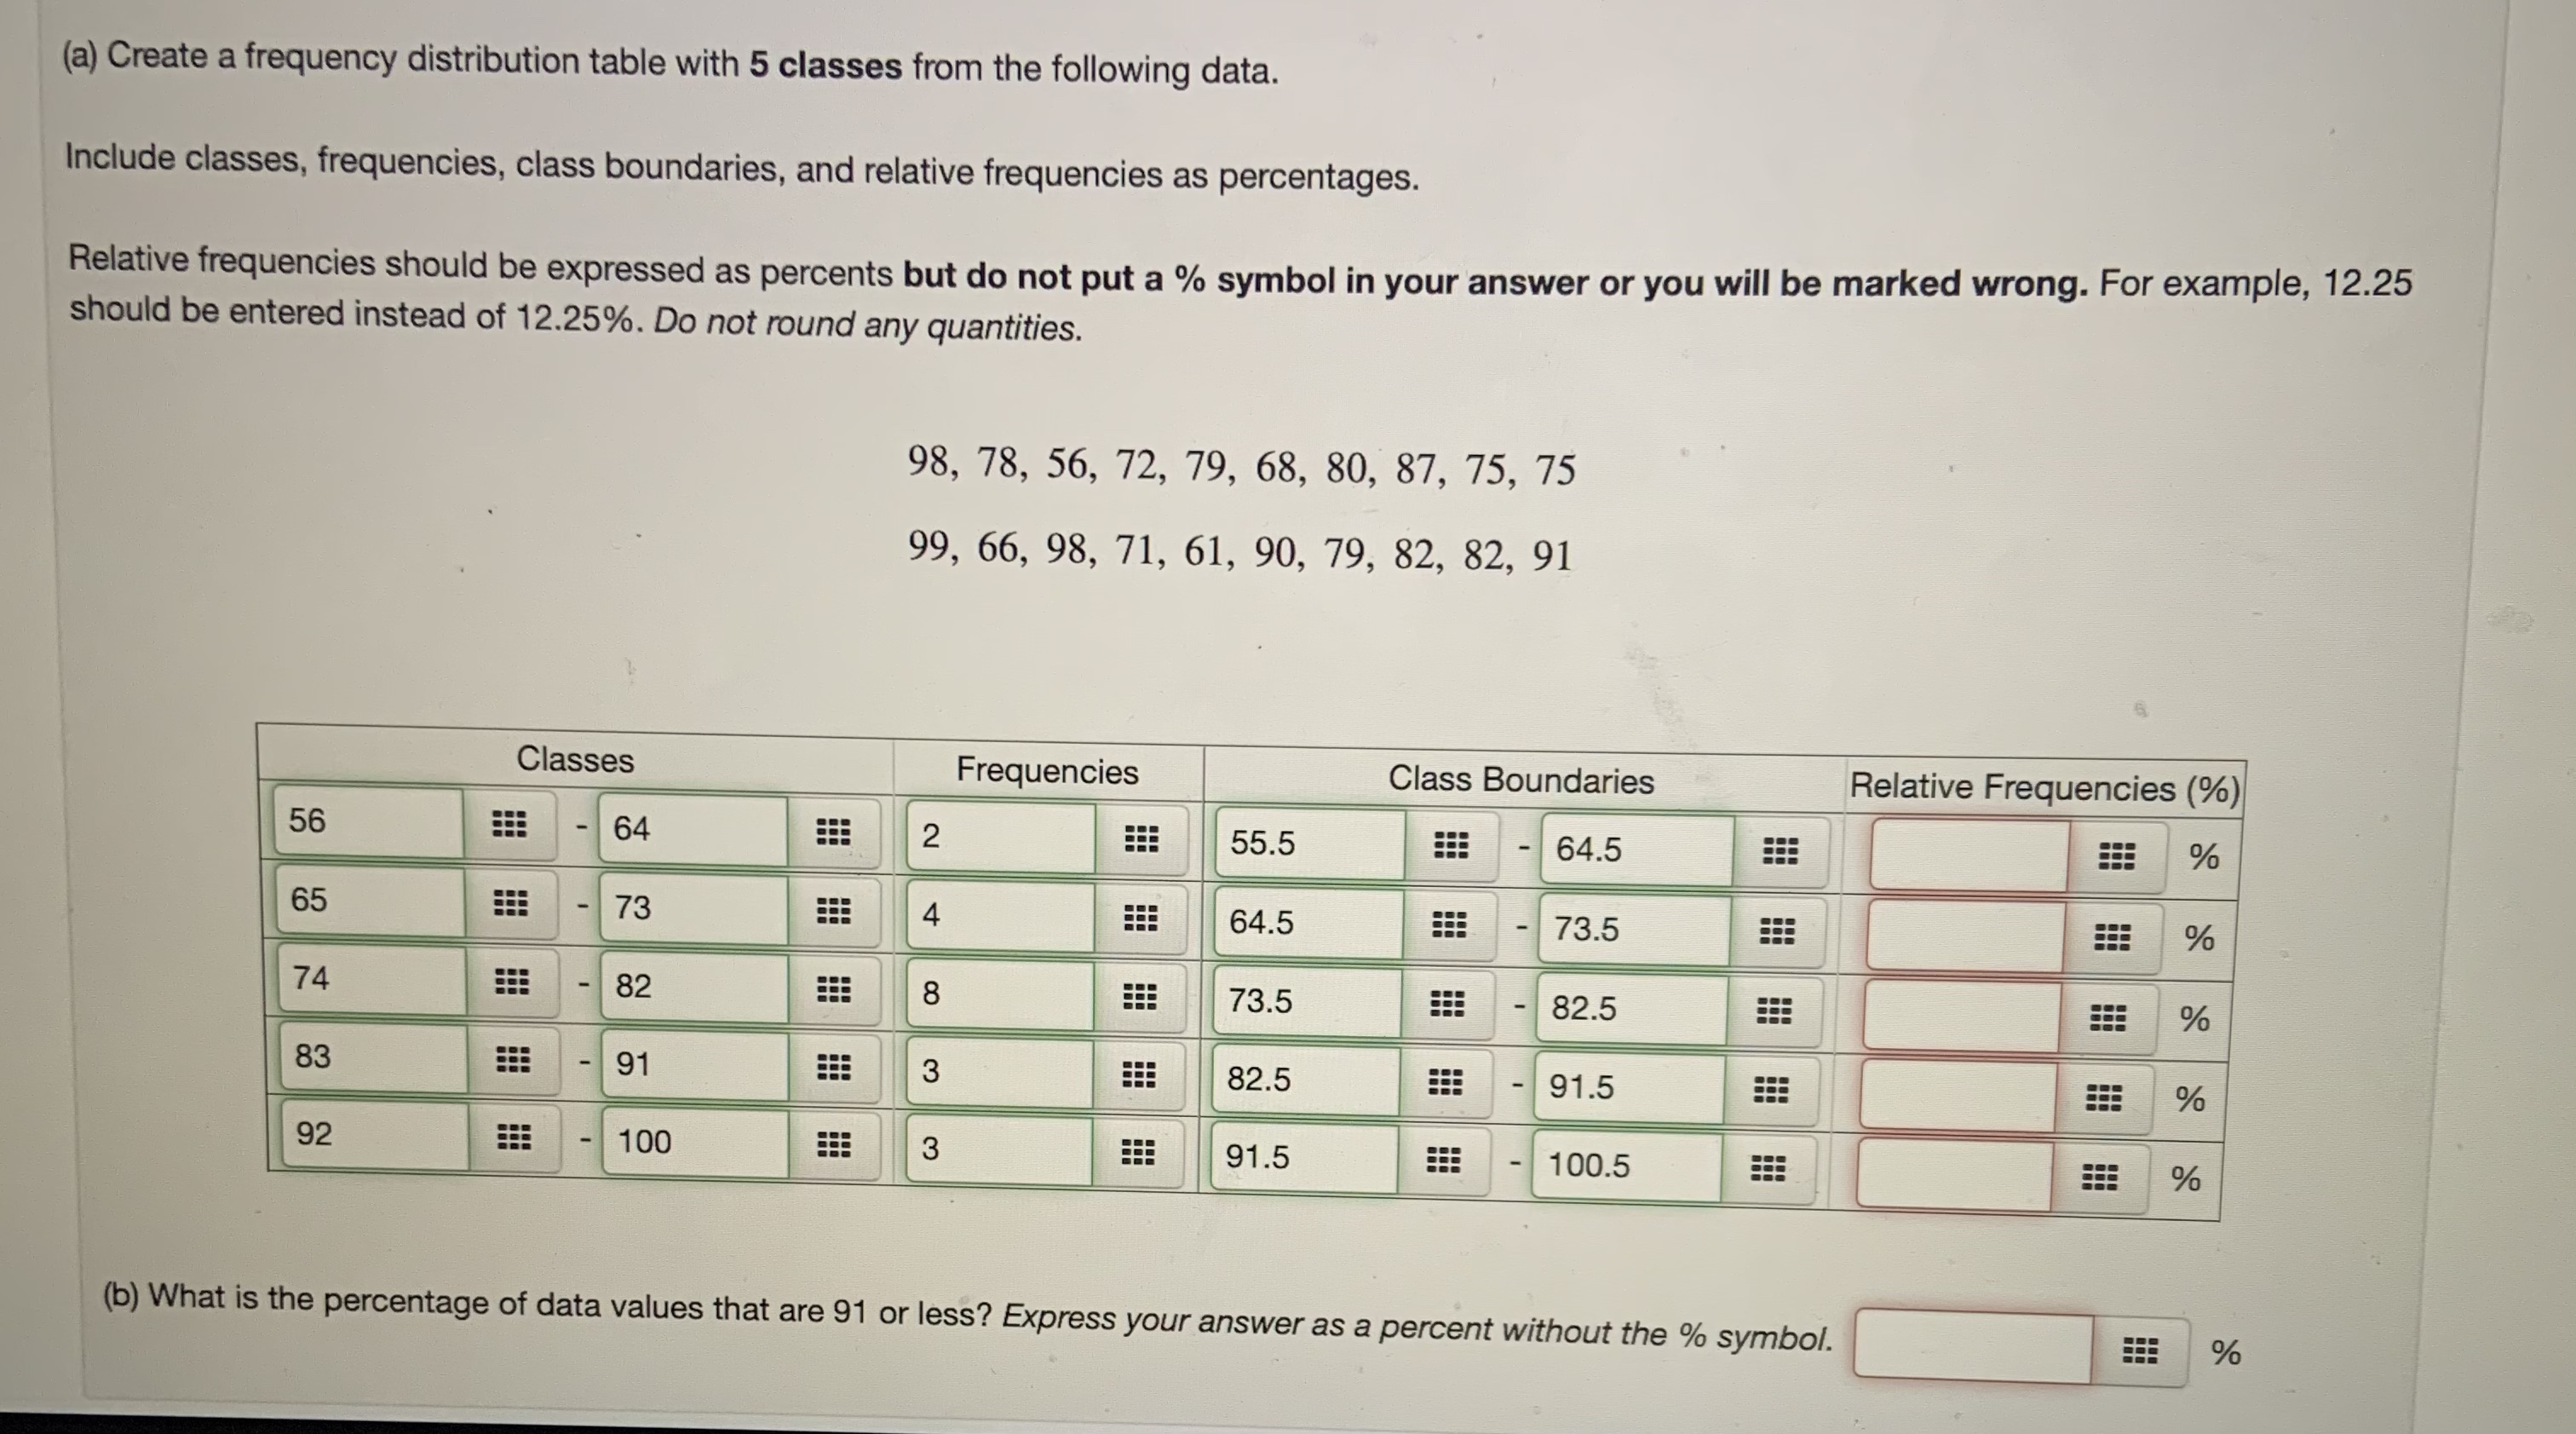
(1 point) From the stem-and-leaf plot below, determine the mean, median and mode(s) of the data. Record answers that are not integers to two decimal places. NOTES: (1) If there is more than one mode, list all of them, separated by commas. (2) If there is no mode, write 'None'. Mean: Median: Mode: 10 9 0124 8 1233477 7 2234566778 6 046 5 0135668 4 3 No(1 point) Mary and John want to make trail mix. In order to get the right balance of ingredients for their tastes they bought 7 pounds of raisins at $3.57 per pound, 6 pounds of peanuts at $4.58 per pound, and 7 pounds of chocolate chips at $3.33 per pound. Determine the cost per pound of the trail mix. Remark: If necessary, round off your result to 2 decimal places. Cost per pound = $(a) Create a frequency distribution table with 5 classes from the following data. Include classes, frequencies, class boundaries, and relative frequencies as percentages. Relative frequencies should be expressed as percents but do not put a % symbol in your answer or you will be marked wrong. For example, 12.25 should be entered instead of 12.25%. Do not round any quantities. 98, 78, 56, 72, 79, 68, 80, 87, 75, 75 99, 66, 98, 71, 61, 90, 79, 82, 82, 91 Classes Frequencies Class Boundaries Relative Frequencies (%) 56 64 2 55.5 64.5 % 65 73 A 64.5 73.5 % 74 82 8 73.5 82.5 83 91 3 82.5 91.5 92 100 3 91.5 100.5 % (b) What is the percentage of data values that are 91 or less? Express your answer as a percent without the % symbol. %
Step by Step Solution
There are 3 Steps involved in it

Get step-by-step solutions from verified subject matter experts