

Question: (1 point) The table below gives the population in a small coastal community for the period 1990 - 1992. Figures shown are for January 1
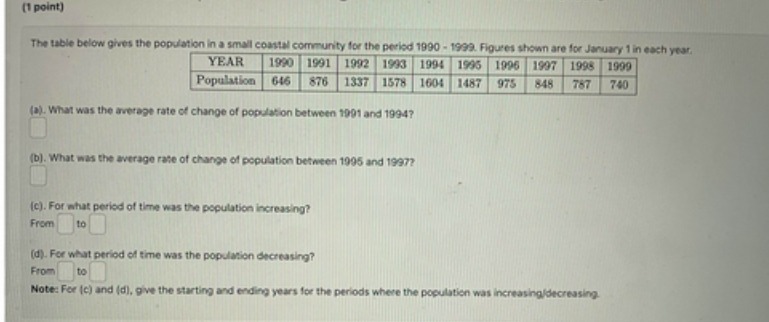
(1 point) The table below gives the population in a small coastal community for the period 1990 - 1992. Figures shown are for January 1 in each year YEAR 1990 1991 1992 1973 1994 1595 1906 1997 1998 1909 Population 646 876 1337 157H 1604 1487 975 8-48 740 (a). What was the average rate of change of population between 1901 and 19947 (b]. What was the average rate of change of population between 1995 and 19972 [c). For what period of time was the population increasing? From (d). For what period of time was the population decreasing? From to Note: For (c) and (d), give the starting and ending years for the periods where the population was increasing decreasing
Step by Step Solution
There are 3 Steps involved in it

Get step-by-step solutions from verified subject matter experts