

Question: (1 point) The table gives the U.S. population from 1790 to 1860. Year Popul. 1790 3,929,000 1800 5,308,000 1810 7,240,000 1820 9,639,000 1830 12,861,000 1840
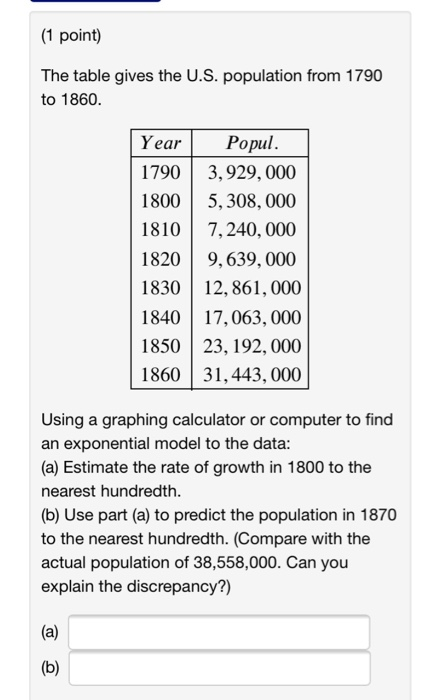
(1 point) The table gives the U.S. population from 1790 to 1860. Year Popul. 1790 3,929,000 1800 5,308,000 1810 7,240,000 1820 9,639,000 1830 12,861,000 1840 17,063,000 1850 23, 192, 000 1860 31, 443,000 Using a graphing calculator or computer to find an exponential model to the data: (a) Estimate the rate of growth in 1800 to the nearest hundredth. (b) Use part (a) to predict the population in 1870 to the nearest hundredth. (Compare with the actual population of 38,558,000. Can you explain the discrepancy?) (a) (b)
Step by Step Solution
There are 3 Steps involved in it
1 Expert Approved Answer
Step: 1 Unlock

Question Has Been Solved by an Expert!
Get step-by-step solutions from verified subject matter experts
Step: 2 Unlock
Step: 3 Unlock