

Question: 1 point You have analyzed return data for all publicly traded firms in the US. You've found that firms which employ Carlson graduates earn abnormal


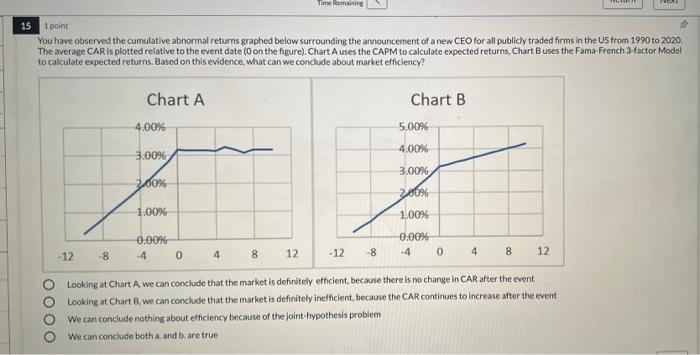
1 point You have analyzed return data for all publicly traded firms in the US. You've found that firms which employ Carlson graduates earn abnormal returns of 5% per year for the two years immediately following the first employment of a Carlson graduate Additionally, you found that firms that hire graduates of the Wisconsin School of Business (WSB) earn abnormal returns of 2% per year for the two years following first employment of a WSB graduate. Which of the following is the best strategy to take advantage of this situation? Short sell $25,000 worth of stock in one company that hired a WSB graduate, and invest the proceeds in one company that hired a Carlson graduate Short sell $25,000 worth of stock in one company that hired a WSB graduate, and invest the proceeds in 25 different companies ($1,000 in each) that hired a Carlson graduate Short sell $1,000 worth of stock in each of 25 companies that hired a WS8 graduate, and invest the proceeds in one company that hired a Carson graduate Short sell $1,000 worth of stock in each of 25 companies that hired a WSB graduate and invest the proceeds in 25 different companies (51.000 in each) that hired a Carlson graduate Previous Next 1 point An actively traded stock is selected at random and its daily price movement relative to the market index examined. Which of the following three sequences is most likely to have occurred over the past six trading days, wherea'sign indicates a stock price change greater than the market and a sign indicates a price change less than the market. Day 1 Day 2 + Day 3 Day 4 Day 5 Day 6 + + Sequence 1. il TIL + + + + + + + + OOOO Sequence Sequence il Sequence ill. All are equally likely Next Previous Time Reminine 15 1 point You have observed the cumulative abnormal returns graphed below surrounding the announcement of a new CEO for all publicly traded firms in the US from 1990 to 2020 The average CAR is plotted relative to the event date ( on the figure). Chart A uses the CAPM to calculate expected returns, Chart Buses the Fama French 3-factor Model to calculate expected returns. Based on this evidence, what can we conclude about market efficiency? Chart A Chart B 4.00% 5.00% 4.00% 3.00% 3.00% 2.00% 200% 1.00% 100% 0.00% 0 0.00% -4 0 - 12 -8 4 8 12 -12 -8 4 8 12 OOOO Looking at Chart A we can conclude that the market is definitely efficient, because there is no change in CAR after the event Looking at Chart B, we can conclude that the market is definitely inefficient, because the CAR continues to increase after the event We can conclude nothing about efficiency because of the joint-hypothesis problem We can conclude both and bare true
Step by Step Solution
There are 3 Steps involved in it

Get step-by-step solutions from verified subject matter experts