

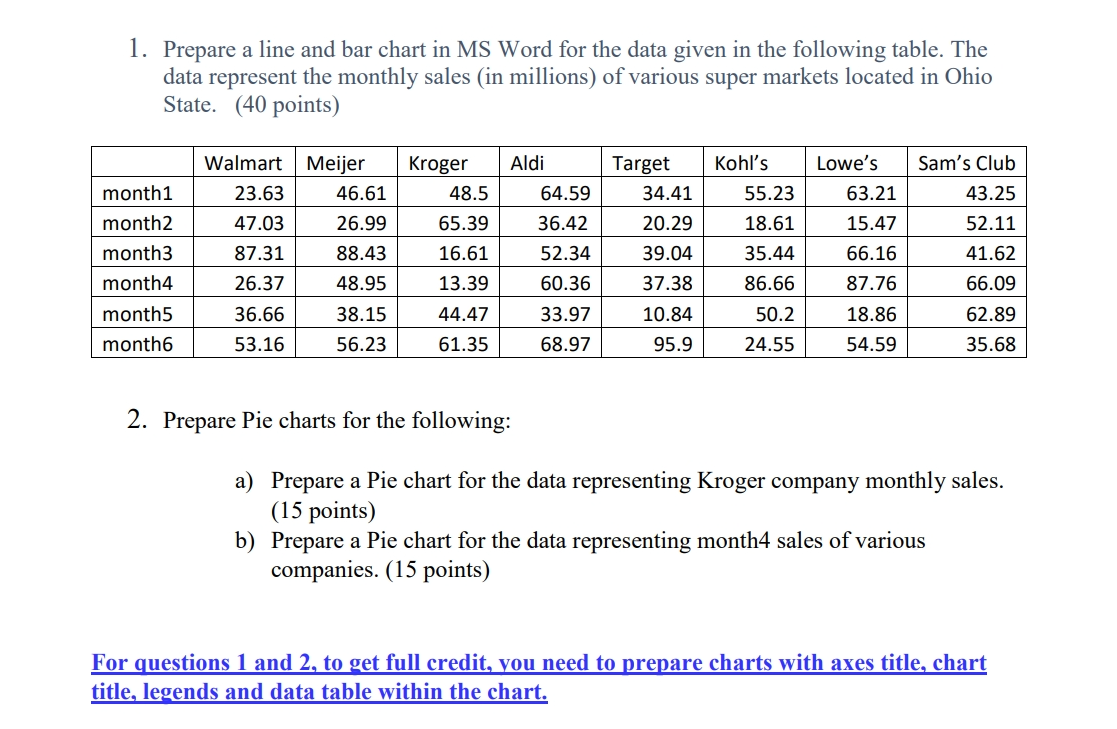
Question: 1 . Prepare a line and bar chart in MS Word for the data given in the following table. The Prepare a line and bar
Prepare a line and bar chart in MS Word for the data given in the following table. The Prepare a line and bar chart in MS Word for the data given in the following table. The data represent the monthly sales in millions of various super markets located in Ohio State. points
tableWalmart,Meijer,Kroger,Aldi,Target,Kohl's,Lowe's,Sam's Clubmonthmonthmonthmonthmonthmonth
Prepare Pie charts for the following:
a Prepare a Pie chart for the data representing Kroger company monthly sales. points
b Prepare a Pie chart for the data representing month sales of various companies. points
For questions and to get full credit, vou need to prepare charts with axes title, chart title, legends and data table within the chart. Prepare Pie charts for the following:
a Prepare a Pie chart for the data representing Kroger company monthly sales.
points
b Prepare a Pie chart for the data representing month sales of various
companies. points
For questions and to get full credit, vou need to prepare charts with axes title, chart
title, legends and data table within the chart.
Prepare your weekly school schedule. The table must have at least rows and columns.
Each cell must have a relevant text. For example, if you have no class during an hour,
you have to write the text in that cell as break. Fill solid blue color for the break free
time hours. Fill solid green color for math classes. points
data represent the monthly sales in millions of various super markets located in Ohio
State. points
Walmart Meijer Kroger Aldi Target Kohls Lowes Sams Club
month
month
month
month
month
month
Prepare Pie charts for the following:
a Prepare a Pie chart for the data representing Kroger company monthly sales.
points
b Prepare a Pie chart for the data representing month sales of various
companies. points
For questions and to get full credit, you need to prepare charts with axes title, chart
title, legends and data table within the chart.
Prepare your weekly school schedule. The table must have at least rows and columns.
Each cell must have a relevant text. For example, if you have no class during an hour,
you have to write the text in that cell as break. Fill solid blue color for the break free
time hours. Fill solid green color for math classes. points
Step by Step Solution
There are 3 Steps involved in it
1 Expert Approved Answer
Step: 1 Unlock

Question Has Been Solved by an Expert!
Get step-by-step solutions from verified subject matter experts
Step: 2 Unlock
Step: 3 Unlock