

Question: 1) Prepare an Operating Asset Management Analysis by calculating for each company the : a) current ratio b) quick ratio c) receivables turnover d) day's
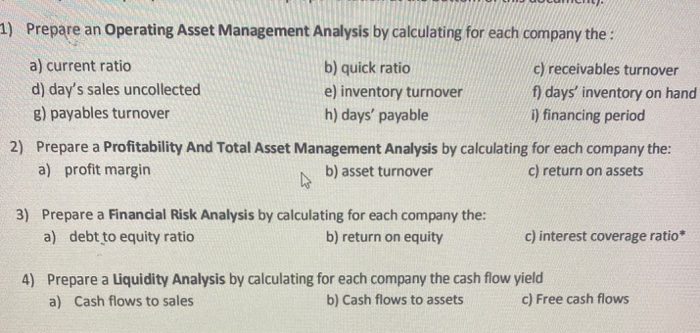
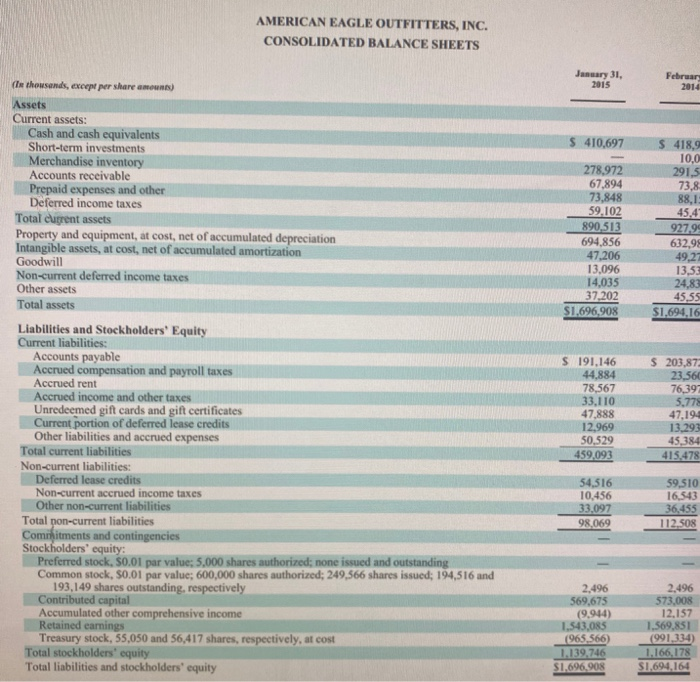
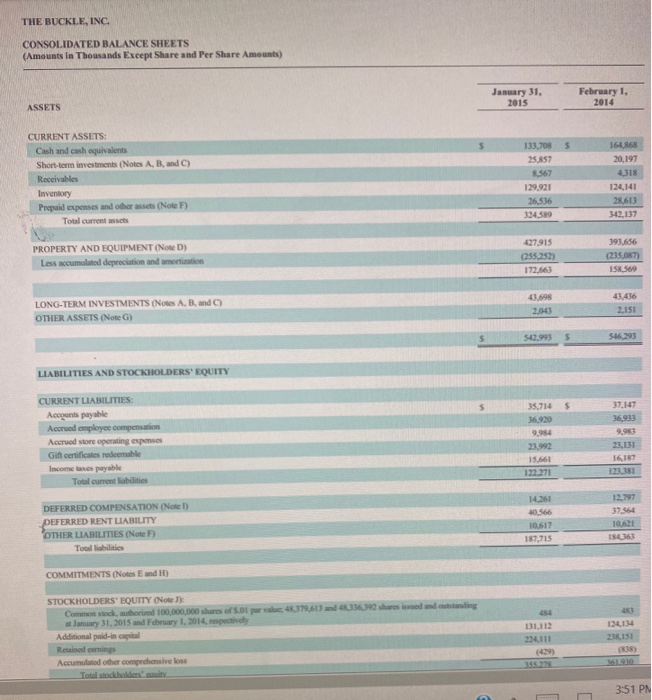
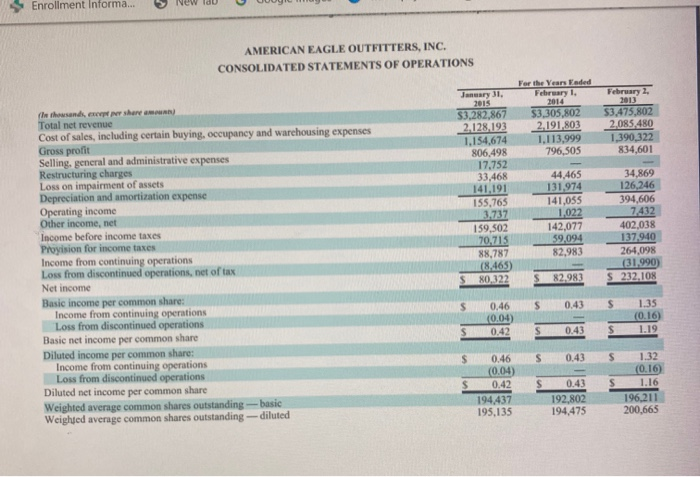
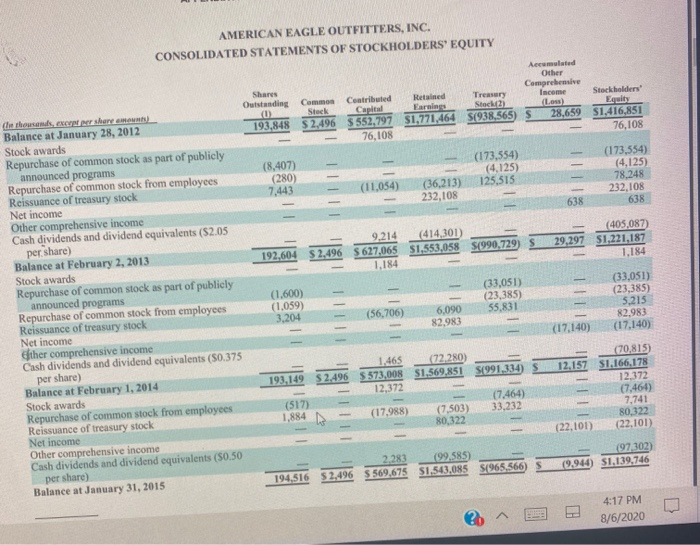
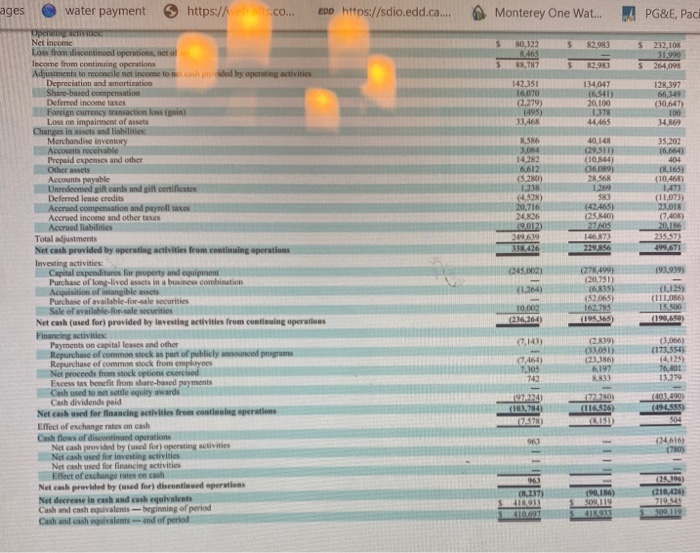
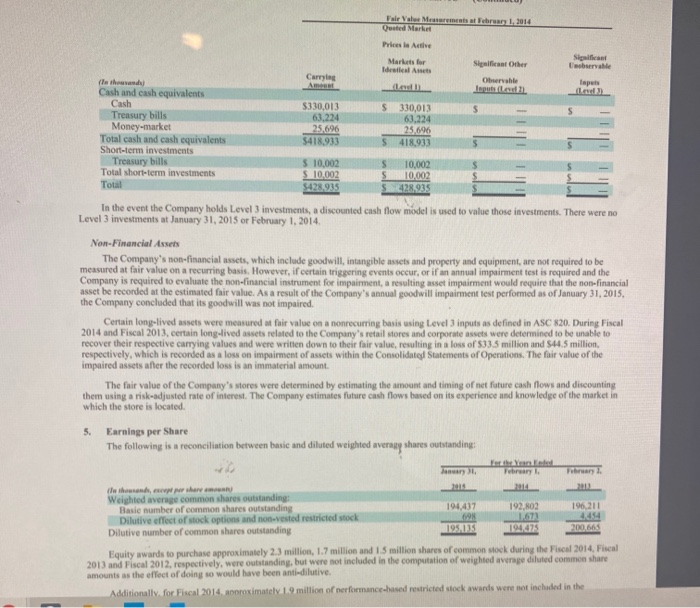
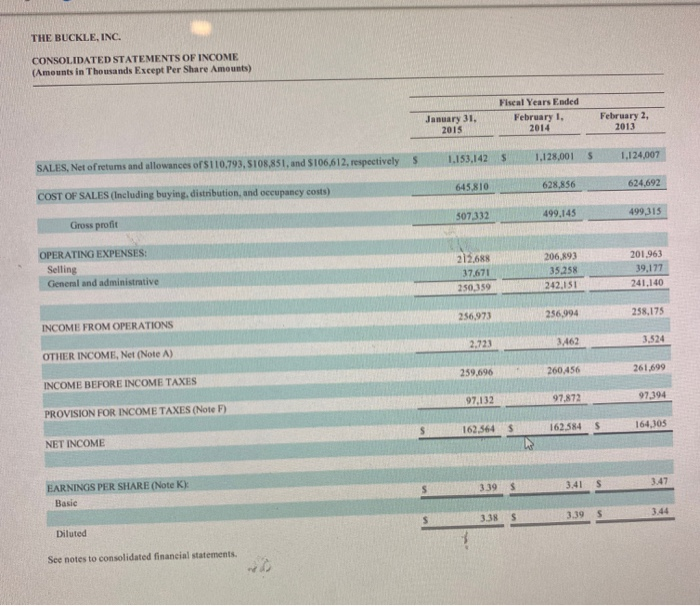
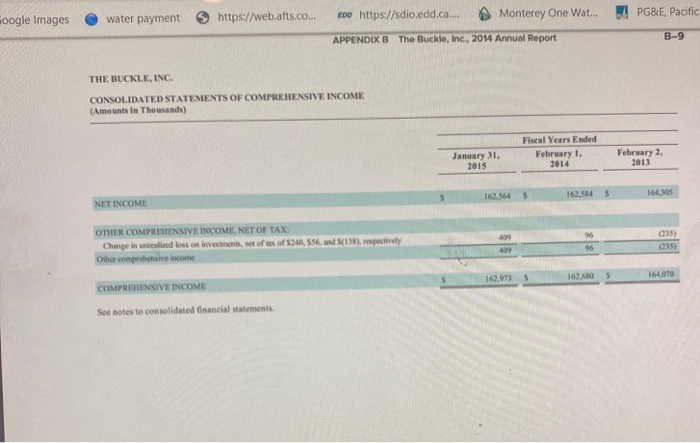
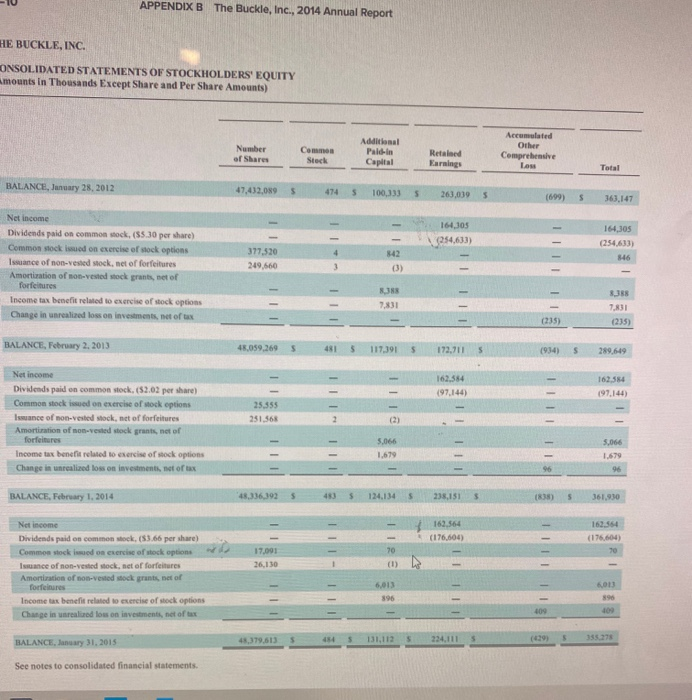
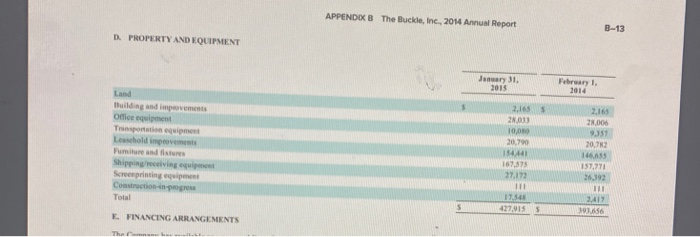
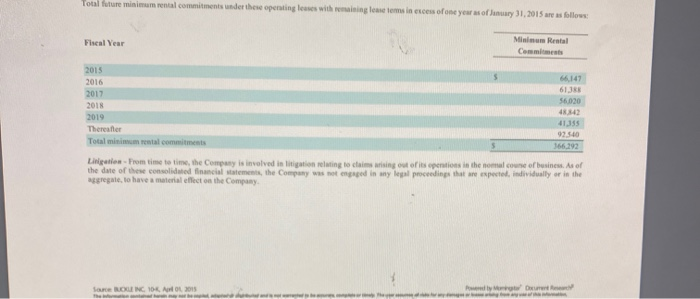
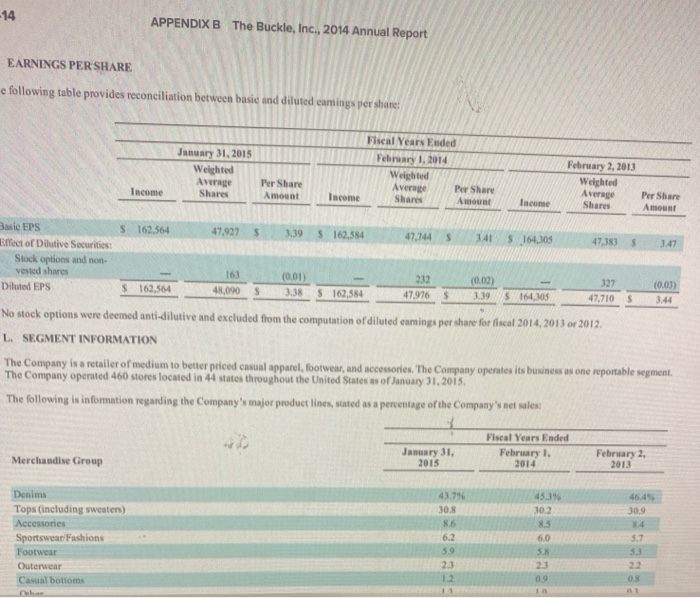
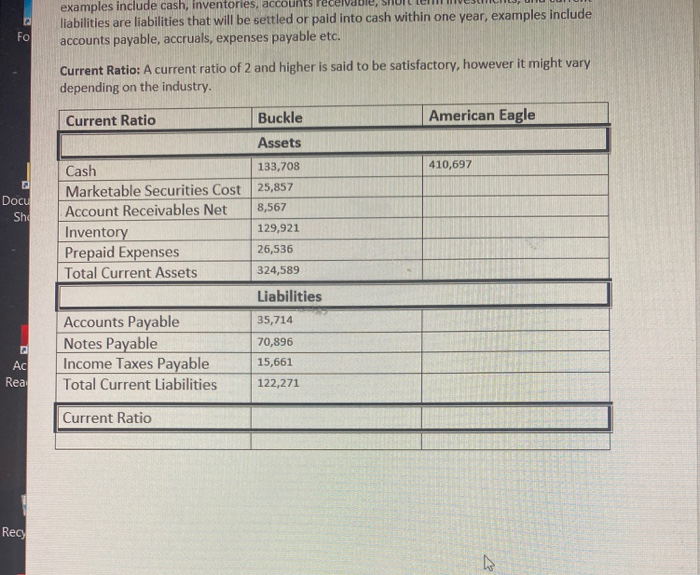
1) Prepare an Operating Asset Management Analysis by calculating for each company the : a) current ratio b) quick ratio c) receivables turnover d) day's sales uncollected e) inventory turnover f) days' inventory on hand g) payables turnover h) days' payable i) financing period 2) Prepare a profitability And Total Asset Management Analysis by calculating for each company the: a) profit margin b) asset turnover c) return on assets 3) Prepare a Financial Risk Analysis by calculating for each company the: a) debt to equity ratio b) return on equity c) interest coverage ratio* 4) Prepare a Liquidity Analysis by calculating for each company the cash flow yield a) Cash flows to sales b) Cash flows to assets c) Free cash flows AMERICAN EAGLE OUTFITTERS, INC. CONSOLIDATED BALANCE SHEETS January 31, 2015 Februar 2014 $ 410,697 278,972 67,894 73,848 59,102 890,513 694,856 47,206 13,096 14,035 37,202 $1,696,908 418,9 10,0 291,5 73,8 88,1 45.4 927.99 632,99 49,27 13,53 24,83 45,55 $1.694.16 (I thousands, except per share amounts) Assets Current assets: Cash and cash equivalents Short-term investments Merchandise inventory Accounts receivable Prepaid expenses and other Deferred income taxes Total current assets Property and equipment, at cost, net of accumulated depreciation Intangible assets, at cost, net of accumulated amortization Goodwill Non-current deferred income taxes Other assets Total assets Liabilities and Stockholders' Equity Current liabilities: Accounts payable Accrued compensation and payroll taxes Accrued rent Accrued income and other taxes Unredeemed gift cards and gift certificates Current portion of deferred lease credits Other liabilities and accrued expenses Total current liabilities Non-current liabilities: Deferred lease credits Non-current accrued income taxes Other non-current liabilities Total non-current liabilities Commitments and contingencies Stockholders' equity: Preferred stock. $0.01 par value; 5,000 shares authorized; none issued and outstanding Common stock, 30.01 par value; 600,000 shares authorized; 249,566 shares issued; 194,516 and 193,149 shares outstanding, respectively Contributed capital Accumulated other comprehensive income Retained earnings Treasury stock, 55,050 and 56,417 shares, respectively, at cost Total stockholders' equity Total liabilities and stockholders' equity S 191,146 44,884 78,567 33.110 47,888 12,969 50,529 459,093 $ 203,87 23,566 76,397 5.778 47,194 13,293 45,384 415.478 54,516 10,456 33,097 98,069 59,510 16,543 36,455 112.508 2,496 569,675 (9.944) 1.543.085 1965.566) 1.139,746 $1.696.908 2,496 573.008 12.157 1,569,851 (991,334 1.166,178 S1,694,164 THE BUCKLE, INC. CONSOLIDATED BALANCE SHEETS (Amounts in Thousands Except Share and Per Share Amounts) January 31, 2015 February 1, 2014 ASSETS 5 CURRENT ASSETS: Cash and cash equivalents Short-term investments (Notes A, B, and C) Receivables Inventory Prepaid expenses and other assets (Note) Total current sets 133,708 25.857 8.567 129,921 26.536 334,589 164.86 20,197 4318 124,141 28,613 342,137 PROPERTY AND EQUIPMENT ( ND) Less accumulated depreciation and amortition 427915 255.252) 172.663 393,656 (235.087) 158_569 LONG-TERM INVESTMENTS (Notes A, B, and OTHER ASSETS (Note G) 43.698 2,043 43.436 2.151 542.993 5 546.293 LIABILITIES AND STOCKHOLDERS' EQUITY CURRENT LIABILITIES: Acounts payable Accrued employee compensation Accrued store operating expenses Gift certificates redeemable Income taxes payable Total current liabilities 35,714 36,920 9.954 23.992 15.461 122.271 37.147 36,933 9.93 23.131 16157 123.351 14.261 40.566 10U617 187,715 12297 37564 10,621 DEFERRED COMPENSATION (Note) DEFERRED RENT LIABILITY OTHER LIABILITIES (Note F) Toulabilities 10363 COMMITMENTS (Notes E and H) 131,112 STOCKHOLDERS' EQUITY (Note : Common stock, authorized 100,000,000 shares of 5.01 por 479.61336.392 here is and wing January 31, 2015 and February 1, 2014. respectively Additional pold-in capital Retained earning Accumulated other comprehensive loss Total stockholdericity 238.151 3:51 PN Enrollment Informa... du AMERICAN EAGLE OUTFITTERS, INC. CONSOLIDATED STATEMENTS OF OPERATIONS For the Year Faded February 1, 2014 $3,305.802 2.191,803 1,113,999 796,505 February 2, 2013 53.475,802 2,085,480 1,390,322 834,601 JanuaryJI, 2015 $3,282,867 2,128,193 1,154,674 806,498 17.752 33,468 141.191 155.765 3.737 159,502 70,715 88,787 (8.465) $ 80,122 (I thousands, share Total net revenue Cost of sales, including certain buying, occupancy and warehousing expenses Gross profit Selling, general and administrative expenses Restructuring charges Loss on impairment of assets Depreciation and amortization expense Operating income Other income, net Income before income taxes Proyision for income taxes Income from continuing operations Loss from discontinued operations, net of tax Net income Basic income per common share: Income from continuing operations Loss from discontinued operations Basic net income per common share Diluted income per common share: Income from continuing operations Loss from discontinued operations Diluted net income per common share Weighted average common shares outstanding --- basic Weighted average common shares outstanding -- diluted 44,465 131,974 141,055 1,022 142,077 59,094 82,983 34,869 126,246 394,606 7.432 402,038 137,940 264,098 (31.990) $ 232,108 $ 82.983 S S 0.43 S 0,46 (0.04) 0.42 1.35 (0.16 1.19 S S 0.43 $ s 0.43 s $ 0.46 (0.04) 0.42 194437 195,135 s 0.43 192,802 194,475 1.32 (0.16) 1.16 196,211 200,665 II III AMERICAN EAGLE OUTFITTERS, INC. CONSOLIDATED STATEMENTS OF STOCKHOLDERS' EQUITY Accumulated Other Shares Comprehensive Outstanding Common Contributed Retained Treasury Income Stockholders' Che thousands or share 0 Steck Capital Earnings Stack 2 (Loss) Equity Balance at January 28, 2012 193,848 $ 2,496 S 552,797 $1,771,464 S(938,565) S 28,659 $1,416,851 Stock awards 76,108 76,108 Repurchase of common stock as part of publicly announced programs (8,407) (173,554) (173,554) Repurchase of common stock from employees (280) (4,125) (4,125) Reissuance of treasury stock 7,443 (11.054) (36,213) 125,515 78,248 Net income 232,108 232,108 Other comprehensive income 638 638 Cash dividends and dividend equivalents (52.05 per share) 9.214 (414,301) (405,087 Balance at February 2, 2013 192,604 $2,496 S 627,065 $1,553,058 $(990,729 29,297 $1,221.187 Stock awards 1,184 1.184 Repurchase of common stock as part of publicly announced programs (1.600) (33,051) (33,051) Repurchase of common stock from employees (1.059) (23,385) (23,385) Reissuance of treasury stock 3.204 (56,706) 6,090 55,831 5.215 Net income 82.983 82.983 either comprehensive income (17.140) (17.140) Cash dividends and dividend equivalents (50.375 per share) 1.465 (72.280) (70.815 Balance at February 1, 2014 193,149 52.496 573,008 $1,569,851 S1991.334) S 12,157 S1,166,178 Stock awards 12,372 12,372 Repurchase of common stock from employees (517) (7.464) (7.464) Reissuance of treasury stock 1,884 (17,988) (7,503) 33.232 7,741 Net income 80,322 80,322 Other comprehensive income (22.101 (22.101) Cash dividends and dividend equivalents (50.50 2.283 (97302) (99,585) per share) Balance at January 31, 2015 194,516 S2.496 S569.675 S1.543.085 S1965,566) S (9.944) 51.139,746 IIIIIIIII ? 4:17 PM 8/6/2020 ages water payment https://t.co... EDD https://sdio.edd.ca... Monterey One Wat... PG&E, Paci 5 82,983 80,122 8.463 88,787 $ $ $ 232,105 31,990 264,098 82,983 142351 16,070 (2.279) 134047 ( 641) 20,100 1.378 44,465 128,397 66 349 (30,647) 100 34,864 33.468 35.202 40,148 (29.511 (10 844) (36.09 2856 8,586 JON 14.282 6.612 (5.2) 1218 (4,528) 20,716 24.826 192017) 20969 38,426 (42.465) (25.8.40) 27S 14673 2294856 404 (8.165) (10,46% TATI (11.073) 23.018 (7.405 2016 235.57) 499,671 193.939 Opera Net income Loss from discontinued operations, net al Income from continuing operations Adjustments to reconcile net income to cash provided by operating activities Depreciation and amortization Share-based compensation Deferred income taxes Foreign currency transaction loss (pain) Loss on impairment of assets Changes in assets and liabilities Merchandise inventory Accounts receivable Prepaid expenses and other Other assets Accounts payable Unredeemed gift cards and gift certificates Deferred lease credits Accrued compensation and payroll taxes Accrued income and other taxes Accrued liabilities Total adjustments Net cash provided by operating activities from continuing operations Investing activities Capital expenditures for property and equipment Purchase of long-lived assets business combination Acquisition of intangible assets Purchase of available for sale securities Sale of available for sale securities Net cash (used for) provided by investing activities from continuing operations Financing activities Payments on capital leases and other Repurchase of common stock as part of publicly med programs Repurchase of common stock from employees Net proceeds from stock options exercised Excess tax benefit from share-based payments Cash used to set settle equity awards Cash dividends paid Net cash used for financing activities from conting operations Effect of exchange rates on cash Cash flow of discontinued operations Net cash provided by (uned for operating stivities Net cashed for investing activities Net cash used for financing activities Effect of exchange rates on cash Net cash provided by used for discontinued operations Net decrease in cash and cash equivalent Cash and cash equivalents-beginning of period Cash and cash equivalents and of period (5.00) (1.264) (27,499 (20,731) 16835) (52.065) 162.783 (195.165 (1.125) (111,086) 15.500 10002 (236,164) (7,143) 7.464) 7.305 742 (2.839) (31.031) ( 236) 6197 8.833 (3.066) (173554) (4,125) 76,401 13.279 1972234) (101,784 (257 (403.490 (494.55 504 1 |||||| (24,616) (70) (117) 415013 410 097 (186) S09 119 (25.396) (210,436) 719549 Fair Value Mermasat February 1, 2014 Qusted Market Prices la Active Significant Markets for Significant Other Laburvale Ideal Arts Carrying (In the Observable Inputs Cash and cash equivalents LU Cash $330,013 $ 330,013 Treasury bills 63,224 63.224 Money-market 25,696 25.696 Total cash and cash equivalents $418,933 s 418,933 Short-term investments Treasury bills $ 10,002 s 10,002 Total short-term investments $ 10,002 s 10.002 Total $428,935 428.935 In the event the Company holds Level 3 investments, a discounted cash flow model is used to value those investments. There were no Level 3 investments at January 31, 2015 or February 1, 2014 Non-Financial Assets The Company's nonefinancial assets, which include goodwill, intangible assets and property and equipment are not required to be measured at fair value on a recurring basis. However, if certain triggering events occur, or if in annual impairment test is required and the Company is required to evaluate the non-financial instrument for impairment, a resulting asset impairment would require that the non-financial asset be recorded at the estimated fair value. As a result of the Company's annual goodwill impairment test performed as of January 31, 2015, the Company concluded that its goodwill was not impaired. Certain long-lived assets were measured at fair value on a nonrecurring basis using Level 3 inputs as defined in ASC 820. During Fiscal 2014 and Fiscal 2013, certain long-lived assets related to the Company's retail stores and corporate assets were determined to be unable to recover their respective carrying values and were written down to their fair value, resulting in a loss of $33.5 million and $44.5 million, respectively, which is recorded as a loss on impairment of assets within the Consolidated Statements of Operations. The fair value of the impaired assets after the recorded loss is an immaterial amount. The fair value of the Company's stores were determined by estimating the amount and timing of net future cash flows and discounting them using a risk-adjusted rate of interest. The Company estimates future cash flows based on its experience and knowledge of the market in which the store is located 5. Earnings per Share The following is a reconciliation between basic and diluted weighted averan shares outstanding January February February fethed, har Weighted average common shares outstanding Basie number of common shares outstanding 194,437 192,802 196,211 Dilutive effect of stock options and non-vested restricted stock 698 1.673 4,454 Dilutive number of common shares outstanding 195,03 194,475 200.65 Equity wards to purchase approximately 2.3 million, 1.7 million and 15 million shares of common stock during the Fiscal 2014, Fiscal 2013 and Fiscal 2012, respectively, were outstanding, but were not included in the computation of weighted average diluted common share amounts as the effect of doing so would have been anti-dilutive Additionally for Fiscal 2014. aproximately 1.9 million of nerformance-based restricted stock awards were not included in the THE BUCKLE, INC. CONSOLIDATED STATEMENTS OF INCOME (Amounts in Thousands Except Per Share Amounts) January 31, 2015 Fiscal Years Ended February 1, 2014 February 2, 2013 1.153.142 $ 1.128,001 $ 1,124,007 SALES, Net of retums and allowances of $110,793, 5108,851 and 5106,612, respectively 645.810 628,856 624,692 COST OF SALES (Including buying, distribution, and occupancy costs) 507332 499,145 499,315 Gross profit OPERATING EXPENSES: Selling General and administrative 212688 37.671 250,359 206,893 35.258 242.151 201,963 39,177 241.140 256,973 256,994 258,175 INCOME FROM OPERATIONS 2,723 3.462 3.524 OTHER INCOME, Net (Note A) 259.696 260.456 261.699 INCOME BEFORE INCOME TAXES 97,132 97,872 97,394 PROVISION FOR INCOME TAXES (Note F) 162.564 $ 162.584 164.305 $ NET INCOME 3.39 $ 3.41 $ EARNINGS PER SHARE (Note K Basic 3.38 $ 3.395 Diluted See notes to consolidated financial statements - oogle Images water payment PG&E, Pacific https://web.afts.co. EDD https://sdio.edd.ca... Monterey One Wat... APPENDIX B The Buckle, Inc., 2014 Annual Report B-9 THE BUCKLE, INC. CONSOLIDATED STATEMENTS OF COMPREHENSIVE INCOME (Amounts in Thousands) Fiscal Years Eaded February 1, January 31, 2015 February 2. 2013 2014 5 162.554 5 164,305 NET INCOME OTHER COMPREHENSIVE INCOME, NET OF TAX: Change in mind loss on investments, set of us of $340,556, and S(138), respectively Other comprehensive Income 96 26 (35) 15 400 162,973 $ 162 AO 164070 COMPREHENSIVE INCOME See notes to consolidated financial statements APPENDIX B The Buckle, Inc., 2014 Annual Report HE BUCKLE, INC. ONSOLIDATED STATEMENTS OF STOCKHOLDERS' EQUITY amounts in Thousands Except Share and Per Share Amounts) Number of Shares Common Stock Additional Paid in Capital Retained Earnings Accumulated Other Comprehensive Loss Total BALANCE, January 28, 2012 47,432,089 5 474 100,333 5 263,019 5 (699) S 363.147 164,305 254,633) 164,305 (254,633) 346 4 Net income Dividends paid on common stock, (55.30 per share) Common stock issued on exercise of stock options Issuance of non-vested stock, net of forfeitures Amortization of non-vested stock grants, net of forfeitures Income tax benefit related to exercise of stock options Change in unrealized loss on investments, net of tax 377.520 249.660 842 (3) 3 BJSS 7,831 (235) 7,831 (235) BALANCE, February 2, 2013 48,059,269 5 481 $ 117.391 5 172,711 (934) s 289,619 162,584 (97,144) 162.584 197.144) Net income Dividends paid on common stock. (S2.02 per share) Common stock issued on exercise of stock options Issuance of non-vested Mock, net of forfeitures Amortization of non-vested stock grants, net of forfeitures Income tax benefit related to exercise of stock options Change in unrealized loss on investments, net of tax 25.355 251.568 2 (2) IIIIII 3,066 1.679 5,066 1.679 96 BALANCE, February 1, 2014 43.336,392 5 $ 124.134 238,151 5 361,930 - III 169.564 (176,604) 162.564 (176.604) 30 70 17.091 26,130 IIIIII 3 Net income Dividends paid on common stock, (53.66 per share) Common stock issued on exercise of stock options Issuance of non-vested stock, set of forfeitures Amortization of non-vested stock grants, net of forfeitures Income tax benefit related to exercise of stock options Change in unrealized loss on investments, net of tax (1) 6,013 396 48,379,613 224.111 5 BALANCE, January 31, 2015 See notes to consolidated financial statements APPENDIX B The Buckle, Inc., 2014 Annual Report B-13 D. PROPERTY AND EQUIPMENT January 31, 2015 February 1 2014 2.165 Land Building and improvements Office equipment Totation equipment Leuschold improvements Pumiture and Shipping receiving Screenprinting equipment Construction progress Total 2.165 2013 10,00 20.700 15444 167,375 27.172 111 28,006 9.357 20,72 11.55 157.771 26.392 111 2:41 393636 S 427,015$ E. FINANCING ARRANGEMENTS Thew Total future minimum rental commitments under the operating love with remaining lone tems in excess of one year of January 31, 2015 are as follows: Fiscal Year Minimum Rental Comments 2015 2016 66.147 613 2017 2018 56,020 2019 Thereafter 4155 92540 Total minimum rental commitments 166.192 Litigation Prom time to time, the Company is involved in litigation relating to claims arising out of its penities in the womal counse of business. As of the date of these consolidated financial walements, the Company was not in any legal proceedings that are expected individually or in the aggregate to have a material effect on the Company Source ROLE INC. 10. 2015 PMD 14 APPENDIX B The Buckle, Inc., 2014 Annual Report EARNINGS PER SHARE e following table provides reconciliation between basic and diluted eamings per share January 31, 2015 Weighted Average Shares Fiscal Years Ended February 1, 2014 Weighted Average Per Share Income Shares Amount February 2, 2013 Weighted Average Shares Per Share Amount Income Income Per Share Amount $ 162.564 47,927 S 3.39 $ 162,584 47,744 5 3.41 S 164,305 47.383 $ 3.47 Basic EPS Effect of Dilutive Securities: Stock options and non vested shares Diluted EPS 163 48,090 $ 162,564 (0.01) 3.38 S $ 162,584 232 47.976 $ (0.02) 3.39 327 47.710 $164,105 (0.03) 3.44 $ No stock options were deemed anti-dilutive and excluded from the computation of diluted camnings per share for fiscal 2014, 2013 or 2012 L. SEGMENT INFORMATION The Company is a retailer of medium to better priced casual apparel, footwear, and accessories. The Company operates its business as one reportable segment The Company operated 460 stores located in 44 states throughout the United States as of January 31, 2015, The following is information regarding the Company's major product lines, stated as a percentage of the Company's net sales: Fiscal Years Ended February 1, 2014 January 31, 2015 Merchandise Group February 2 2013 46.49 30.9 Denims Tops (including sweaters) Accessories Sportswear Fashions Footwear Outerwear Casual bottoms 43.796 30.8 8.6 6.2 5.9 2.3 1.2 11 45.3% 30.2 8.5 6.0 5.8 23 0.9 5.7 33 08 1 In examples include cash, inventories, accounts liabilities are liabilities that will be settled or paid into cash within one year, examples include accounts payable, accruals, expenses payable etc. Fo Current Ratio: A current ratio of 2 and higher is said to be satisfactory, however it might vary depending on the industry. Current Ratio Buckle American Eagle Assets 410,697 Docu Sho Cash 133,708 Marketable Securities Cost 25,857 Account Receivables Net 8,567 Inventory 129,921 Prepaid Expenses 26,536 Total Current Assets 324,589 Liabilities Accounts Payable 35,714 Notes Payable 70,896 Income Taxes Payable 15,661 Total Current Liabilities 122,271 Rea Current Ratio Rec N 1) Prepare an Operating Asset Management Analysis by calculating for each company the : a) current ratio b) quick ratio c) receivables turnover d) day's sales uncollected e) inventory turnover f) days' inventory on hand g) payables turnover h) days' payable i) financing period 2) Prepare a profitability And Total Asset Management Analysis by calculating for each company the: a) profit margin b) asset turnover c) return on assets 3) Prepare a Financial Risk Analysis by calculating for each company the: a) debt to equity ratio b) return on equity c) interest coverage ratio* 4) Prepare a Liquidity Analysis by calculating for each company the cash flow yield a) Cash flows to sales b) Cash flows to assets c) Free cash flows AMERICAN EAGLE OUTFITTERS, INC. CONSOLIDATED BALANCE SHEETS January 31, 2015 Februar 2014 $ 410,697 278,972 67,894 73,848 59,102 890,513 694,856 47,206 13,096 14,035 37,202 $1,696,908 418,9 10,0 291,5 73,8 88,1 45.4 927.99 632,99 49,27 13,53 24,83 45,55 $1.694.16 (I thousands, except per share amounts) Assets Current assets: Cash and cash equivalents Short-term investments Merchandise inventory Accounts receivable Prepaid expenses and other Deferred income taxes Total current assets Property and equipment, at cost, net of accumulated depreciation Intangible assets, at cost, net of accumulated amortization Goodwill Non-current deferred income taxes Other assets Total assets Liabilities and Stockholders' Equity Current liabilities: Accounts payable Accrued compensation and payroll taxes Accrued rent Accrued income and other taxes Unredeemed gift cards and gift certificates Current portion of deferred lease credits Other liabilities and accrued expenses Total current liabilities Non-current liabilities: Deferred lease credits Non-current accrued income taxes Other non-current liabilities Total non-current liabilities Commitments and contingencies Stockholders' equity: Preferred stock. $0.01 par value; 5,000 shares authorized; none issued and outstanding Common stock, 30.01 par value; 600,000 shares authorized; 249,566 shares issued; 194,516 and 193,149 shares outstanding, respectively Contributed capital Accumulated other comprehensive income Retained earnings Treasury stock, 55,050 and 56,417 shares, respectively, at cost Total stockholders' equity Total liabilities and stockholders' equity S 191,146 44,884 78,567 33.110 47,888 12,969 50,529 459,093 $ 203,87 23,566 76,397 5.778 47,194 13,293 45,384 415.478 54,516 10,456 33,097 98,069 59,510 16,543 36,455 112.508 2,496 569,675 (9.944) 1.543.085 1965.566) 1.139,746 $1.696.908 2,496 573.008 12.157 1,569,851 (991,334 1.166,178 S1,694,164 THE BUCKLE, INC. CONSOLIDATED BALANCE SHEETS (Amounts in Thousands Except Share and Per Share Amounts) January 31, 2015 February 1, 2014 ASSETS 5 CURRENT ASSETS: Cash and cash equivalents Short-term investments (Notes A, B, and C) Receivables Inventory Prepaid expenses and other assets (Note) Total current sets 133,708 25.857 8.567 129,921 26.536 334,589 164.86 20,197 4318 124,141 28,613 342,137 PROPERTY AND EQUIPMENT ( ND) Less accumulated depreciation and amortition 427915 255.252) 172.663 393,656 (235.087) 158_569 LONG-TERM INVESTMENTS (Notes A, B, and OTHER ASSETS (Note G) 43.698 2,043 43.436 2.151 542.993 5 546.293 LIABILITIES AND STOCKHOLDERS' EQUITY CURRENT LIABILITIES: Acounts payable Accrued employee compensation Accrued store operating expenses Gift certificates redeemable Income taxes payable Total current liabilities 35,714 36,920 9.954 23.992 15.461 122.271 37.147 36,933 9.93 23.131 16157 123.351 14.261 40.566 10U617 187,715 12297 37564 10,621 DEFERRED COMPENSATION (Note) DEFERRED RENT LIABILITY OTHER LIABILITIES (Note F) Toulabilities 10363 COMMITMENTS (Notes E and H) 131,112 STOCKHOLDERS' EQUITY (Note : Common stock, authorized 100,000,000 shares of 5.01 por 479.61336.392 here is and wing January 31, 2015 and February 1, 2014. respectively Additional pold-in capital Retained earning Accumulated other comprehensive loss Total stockholdericity 238.151 3:51 PN Enrollment Informa... du AMERICAN EAGLE OUTFITTERS, INC. CONSOLIDATED STATEMENTS OF OPERATIONS For the Year Faded February 1, 2014 $3,305.802 2.191,803 1,113,999 796,505 February 2, 2013 53.475,802 2,085,480 1,390,322 834,601 JanuaryJI, 2015 $3,282,867 2,128,193 1,154,674 806,498 17.752 33,468 141.191 155.765 3.737 159,502 70,715 88,787 (8.465) $ 80,122 (I thousands, share Total net revenue Cost of sales, including certain buying, occupancy and warehousing expenses Gross profit Selling, general and administrative expenses Restructuring charges Loss on impairment of assets Depreciation and amortization expense Operating income Other income, net Income before income taxes Proyision for income taxes Income from continuing operations Loss from discontinued operations, net of tax Net income Basic income per common share: Income from continuing operations Loss from discontinued operations Basic net income per common share Diluted income per common share: Income from continuing operations Loss from discontinued operations Diluted net income per common share Weighted average common shares outstanding --- basic Weighted average common shares outstanding -- diluted 44,465 131,974 141,055 1,022 142,077 59,094 82,983 34,869 126,246 394,606 7.432 402,038 137,940 264,098 (31.990) $ 232,108 $ 82.983 S S 0.43 S 0,46 (0.04) 0.42 1.35 (0.16 1.19 S S 0.43 $ s 0.43 s $ 0.46 (0.04) 0.42 194437 195,135 s 0.43 192,802 194,475 1.32 (0.16) 1.16 196,211 200,665 II III AMERICAN EAGLE OUTFITTERS, INC. CONSOLIDATED STATEMENTS OF STOCKHOLDERS' EQUITY Accumulated Other Shares Comprehensive Outstanding Common Contributed Retained Treasury Income Stockholders' Che thousands or share 0 Steck Capital Earnings Stack 2 (Loss) Equity Balance at January 28, 2012 193,848 $ 2,496 S 552,797 $1,771,464 S(938,565) S 28,659 $1,416,851 Stock awards 76,108 76,108 Repurchase of common stock as part of publicly announced programs (8,407) (173,554) (173,554) Repurchase of common stock from employees (280) (4,125) (4,125) Reissuance of treasury stock 7,443 (11.054) (36,213) 125,515 78,248 Net income 232,108 232,108 Other comprehensive income 638 638 Cash dividends and dividend equivalents (52.05 per share) 9.214 (414,301) (405,087 Balance at February 2, 2013 192,604 $2,496 S 627,065 $1,553,058 $(990,729 29,297 $1,221.187 Stock awards 1,184 1.184 Repurchase of common stock as part of publicly announced programs (1.600) (33,051) (33,051) Repurchase of common stock from employees (1.059) (23,385) (23,385) Reissuance of treasury stock 3.204 (56,706) 6,090 55,831 5.215 Net income 82.983 82.983 either comprehensive income (17.140) (17.140) Cash dividends and dividend equivalents (50.375 per share) 1.465 (72.280) (70.815 Balance at February 1, 2014 193,149 52.496 573,008 $1,569,851 S1991.334) S 12,157 S1,166,178 Stock awards 12,372 12,372 Repurchase of common stock from employees (517) (7.464) (7.464) Reissuance of treasury stock 1,884 (17,988) (7,503) 33.232 7,741 Net income 80,322 80,322 Other comprehensive income (22.101 (22.101) Cash dividends and dividend equivalents (50.50 2.283 (97302) (99,585) per share) Balance at January 31, 2015 194,516 S2.496 S569.675 S1.543.085 S1965,566) S (9.944) 51.139,746 IIIIIIIII ? 4:17 PM 8/6/2020 ages water payment https://t.co... EDD https://sdio.edd.ca... Monterey One Wat... PG&E, Paci 5 82,983 80,122 8.463 88,787 $ $ $ 232,105 31,990 264,098 82,983 142351 16,070 (2.279) 134047 ( 641) 20,100 1.378 44,465 128,397 66 349 (30,647) 100 34,864 33.468 35.202 40,148 (29.511 (10 844) (36.09 2856 8,586 JON 14.282 6.612 (5.2) 1218 (4,528) 20,716 24.826 192017) 20969 38,426 (42.465) (25.8.40) 27S 14673 2294856 404 (8.165) (10,46% TATI (11.073) 23.018 (7.405 2016 235.57) 499,671 193.939 Opera Net income Loss from discontinued operations, net al Income from continuing operations Adjustments to reconcile net income to cash provided by operating activities Depreciation and amortization Share-based compensation Deferred income taxes Foreign currency transaction loss (pain) Loss on impairment of assets Changes in assets and liabilities Merchandise inventory Accounts receivable Prepaid expenses and other Other assets Accounts payable Unredeemed gift cards and gift certificates Deferred lease credits Accrued compensation and payroll taxes Accrued income and other taxes Accrued liabilities Total adjustments Net cash provided by operating activities from continuing operations Investing activities Capital expenditures for property and equipment Purchase of long-lived assets business combination Acquisition of intangible assets Purchase of available for sale securities Sale of available for sale securities Net cash (used for) provided by investing activities from continuing operations Financing activities Payments on capital leases and other Repurchase of common stock as part of publicly med programs Repurchase of common stock from employees Net proceeds from stock options exercised Excess tax benefit from share-based payments Cash used to set settle equity awards Cash dividends paid Net cash used for financing activities from conting operations Effect of exchange rates on cash Cash flow of discontinued operations Net cash provided by (uned for operating stivities Net cashed for investing activities Net cash used for financing activities Effect of exchange rates on cash Net cash provided by used for discontinued operations Net decrease in cash and cash equivalent Cash and cash equivalents-beginning of period Cash and cash equivalents and of period (5.00) (1.264) (27,499 (20,731) 16835) (52.065) 162.783 (195.165 (1.125) (111,086) 15.500 10002 (236,164) (7,143) 7.464) 7.305 742 (2.839) (31.031) ( 236) 6197 8.833 (3.066) (173554) (4,125) 76,401 13.279 1972234) (101,784 (257 (403.490 (494.55 504 1 |||||| (24,616) (70) (117) 415013 410 097 (186) S09 119 (25.396) (210,436) 719549 Fair Value Mermasat February 1, 2014 Qusted Market Prices la Active Significant Markets for Significant Other Laburvale Ideal Arts Carrying (In the Observable Inputs Cash and cash equivalents LU Cash $330,013 $ 330,013 Treasury bills 63,224 63.224 Money-market 25,696 25.696 Total cash and cash equivalents $418,933 s 418,933 Short-term investments Treasury bills $ 10,002 s 10,002 Total short-term investments $ 10,002 s 10.002 Total $428,935 428.935 In the event the Company holds Level 3 investments, a discounted cash flow model is used to value those investments. There were no Level 3 investments at January 31, 2015 or February 1, 2014 Non-Financial Assets The Company's nonefinancial assets, which include goodwill, intangible assets and property and equipment are not required to be measured at fair value on a recurring basis. However, if certain triggering events occur, or if in annual impairment test is required and the Company is required to evaluate the non-financial instrument for impairment, a resulting asset impairment would require that the non-financial asset be recorded at the estimated fair value. As a result of the Company's annual goodwill impairment test performed as of January 31, 2015, the Company concluded that its goodwill was not impaired. Certain long-lived assets were measured at fair value on a nonrecurring basis using Level 3 inputs as defined in ASC 820. During Fiscal 2014 and Fiscal 2013, certain long-lived assets related to the Company's retail stores and corporate assets were determined to be unable to recover their respective carrying values and were written down to their fair value, resulting in a loss of $33.5 million and $44.5 million, respectively, which is recorded as a loss on impairment of assets within the Consolidated Statements of Operations. The fair value of the impaired assets after the recorded loss is an immaterial amount. The fair value of the Company's stores were determined by estimating the amount and timing of net future cash flows and discounting them using a risk-adjusted rate of interest. The Company estimates future cash flows based on its experience and knowledge of the market in which the store is located 5. Earnings per Share The following is a reconciliation between basic and diluted weighted averan shares outstanding January February February fethed, har Weighted average common shares outstanding Basie number of common shares outstanding 194,437 192,802 196,211 Dilutive effect of stock options and non-vested restricted stock 698 1.673 4,454 Dilutive number of common shares outstanding 195,03 194,475 200.65 Equity wards to purchase approximately 2.3 million, 1.7 million and 15 million shares of common stock during the Fiscal 2014, Fiscal 2013 and Fiscal 2012, respectively, were outstanding, but were not included in the computation of weighted average diluted common share amounts as the effect of doing so would have been anti-dilutive Additionally for Fiscal 2014. aproximately 1.9 million of nerformance-based restricted stock awards were not included in the THE BUCKLE, INC. CONSOLIDATED STATEMENTS OF INCOME (Amounts in Thousands Except Per Share Amounts) January 31, 2015 Fiscal Years Ended February 1, 2014 February 2, 2013 1.153.142 $ 1.128,001 $ 1,124,007 SALES, Net of retums and allowances of $110,793, 5108,851 and 5106,612, respectively 645.810 628,856 624,692 COST OF SALES (Including buying, distribution, and occupancy costs) 507332 499,145 499,315 Gross profit OPERATING EXPENSES: Selling General and administrative 212688 37.671 250,359 206,893 35.258 242.151 201,963 39,177 241.140 256,973 256,994 258,175 INCOME FROM OPERATIONS 2,723 3.462 3.524 OTHER INCOME, Net (Note A) 259.696 260.456 261.699 INCOME BEFORE INCOME TAXES 97,132 97,872 97,394 PROVISION FOR INCOME TAXES (Note F) 162.564 $ 162.584 164.305 $ NET INCOME 3.39 $ 3.41 $ EARNINGS PER SHARE (Note K Basic 3.38 $ 3.395 Diluted See notes to consolidated financial statements - oogle Images water payment PG&E, Pacific https://web.afts.co. EDD https://sdio.edd.ca... Monterey One Wat... APPENDIX B The Buckle, Inc., 2014 Annual Report B-9 THE BUCKLE, INC. CONSOLIDATED STATEMENTS OF COMPREHENSIVE INCOME (Amounts in Thousands) Fiscal Years Eaded February 1, January 31, 2015 February 2. 2013 2014 5 162.554 5 164,305 NET INCOME OTHER COMPREHENSIVE INCOME, NET OF TAX: Change in mind loss on investments, set of us of $340,556, and S(138), respectively Other comprehensive Income 96 26 (35) 15 400 162,973 $ 162 AO 164070 COMPREHENSIVE INCOME See notes to consolidated financial statements APPENDIX B The Buckle, Inc., 2014 Annual Report HE BUCKLE, INC. ONSOLIDATED STATEMENTS OF STOCKHOLDERS' EQUITY amounts in Thousands Except Share and Per Share Amounts) Number of Shares Common Stock Additional Paid in Capital Retained Earnings Accumulated Other Comprehensive Loss Total BALANCE, January 28, 2012 47,432,089 5 474 100,333 5 263,019 5 (699) S 363.147 164,305 254,633) 164,305 (254,633) 346 4 Net income Dividends paid on common stock, (55.30 per share) Common stock issued on exercise of stock options Issuance of non-vested stock, net of forfeitures Amortization of non-vested stock grants, net of forfeitures Income tax benefit related to exercise of stock options Change in unrealized loss on investments, net of tax 377.520 249.660 842 (3) 3 BJSS 7,831 (235) 7,831 (235) BALANCE, February 2, 2013 48,059,269 5 481 $ 117.391 5 172,711 (934) s 289,619 162,584 (97,144) 162.584 197.144) Net income Dividends paid on common stock. (S2.02 per share) Common stock issued on exercise of stock options Issuance of non-vested Mock, net of forfeitures Amortization of non-vested stock grants, net of forfeitures Income tax benefit related to exercise of stock options Change in unrealized loss on investments, net of tax 25.355 251.568 2 (2) IIIIII 3,066 1.679 5,066 1.679 96 BALANCE, February 1, 2014 43.336,392 5 $ 124.134 238,151 5 361,930 - III 169.564 (176,604) 162.564 (176.604) 30 70 17.091 26,130 IIIIII 3 Net income Dividends paid on common stock, (53.66 per share) Common stock issued on exercise of stock options Issuance of non-vested stock, set of forfeitures Amortization of non-vested stock grants, net of forfeitures Income tax benefit related to exercise of stock options Change in unrealized loss on investments, net of tax (1) 6,013 396 48,379,613 224.111 5 BALANCE, January 31, 2015 See notes to consolidated financial statements APPENDIX B The Buckle, Inc., 2014 Annual Report B-13 D. PROPERTY AND EQUIPMENT January 31, 2015 February 1 2014 2.165 Land Building and improvements Office equipment Totation equipment Leuschold improvements Pumiture and Shipping receiving Screenprinting equipment Construction progress Total 2.165 2013 10,00 20.700 15444 167,375 27.172 111 28,006 9.357 20,72 11.55 157.771 26.392 111 2:41 393636 S 427,015$ E. FINANCING ARRANGEMENTS Thew Total future minimum rental commitments under the operating love with remaining lone tems in excess of one year of January 31, 2015 are as follows: Fiscal Year Minimum Rental Comments 2015 2016 66.147 613 2017 2018 56,020 2019 Thereafter 4155 92540 Total minimum rental commitments 166.192 Litigation Prom time to time, the Company is involved in litigation relating to claims arising out of its penities in the womal counse of business. As of the date of these consolidated financial walements, the Company was not in any legal proceedings that are expected individually or in the aggregate to have a material effect on the Company Source ROLE INC. 10. 2015 PMD 14 APPENDIX B The Buckle, Inc., 2014 Annual Report EARNINGS PER SHARE e following table provides reconciliation between basic and diluted eamings per share January 31, 2015 Weighted Average Shares Fiscal Years Ended February 1, 2014 Weighted Average Per Share Income Shares Amount February 2, 2013 Weighted Average Shares Per Share Amount Income Income Per Share Amount $ 162.564 47,927 S 3.39 $ 162,584 47,744 5 3.41 S 164,305 47.383 $ 3.47 Basic EPS Effect of Dilutive Securities: Stock options and non vested shares Diluted EPS 163 48,090 $ 162,564 (0.01) 3.38 S $ 162,584 232 47.976 $ (0.02) 3.39 327 47.710 $164,105 (0.03) 3.44 $ No stock options were deemed anti-dilutive and excluded from the computation of diluted camnings per share for fiscal 2014, 2013 or 2012 L. SEGMENT INFORMATION The Company is a retailer of medium to better priced casual apparel, footwear, and accessories. The Company operates its business as one reportable segment The Company operated 460 stores located in 44 states throughout the United States as of January 31, 2015, The following is information regarding the Company's major product lines, stated as a percentage of the Company's net sales: Fiscal Years Ended February 1, 2014 January 31, 2015 Merchandise Group February 2 2013 46.49 30.9 Denims Tops (including sweaters) Accessories Sportswear Fashions Footwear Outerwear Casual bottoms 43.796 30.8 8.6 6.2 5.9 2.3 1.2 11 45.3% 30.2 8.5 6.0 5.8 23 0.9 5.7 33 08 1 In examples include cash, inventories, accounts liabilities are liabilities that will be settled or paid into cash within one year, examples include accounts payable, accruals, expenses payable etc. Fo Current Ratio: A current ratio of 2 and higher is said to be satisfactory, however it might vary depending on the industry. Current Ratio Buckle American Eagle Assets 410,697 Docu Sho Cash 133,708 Marketable Securities Cost 25,857 Account Receivables Net 8,567 Inventory 129,921 Prepaid Expenses 26,536 Total Current Assets 324,589 Liabilities Accounts Payable 35,714 Notes Payable 70,896 Income Taxes Payable 15,661 Total Current Liabilities 122,271 Rea Current Ratio Rec N
Step by Step Solution
There are 3 Steps involved in it

Get step-by-step solutions from verified subject matter experts