

Question: 1) Prepare an Operating Asset Management Analysis by calculating for each company the : a) current ratio b) quick ratio c) receivables turnover d) days
1) Prepare an Operating Asset Management Analysis by calculating for each company the :
a) current ratio b) quick ratio c) receivables turnover d) days sales uncollected e) inventory turnover f) days inventory on hand g) payables turnover h) days payable i) financing period
2) Prepare a Profitability And Total Asset Management Analysis by calculating for each company the:
a) profit margin b) asset turnover c) return on assets
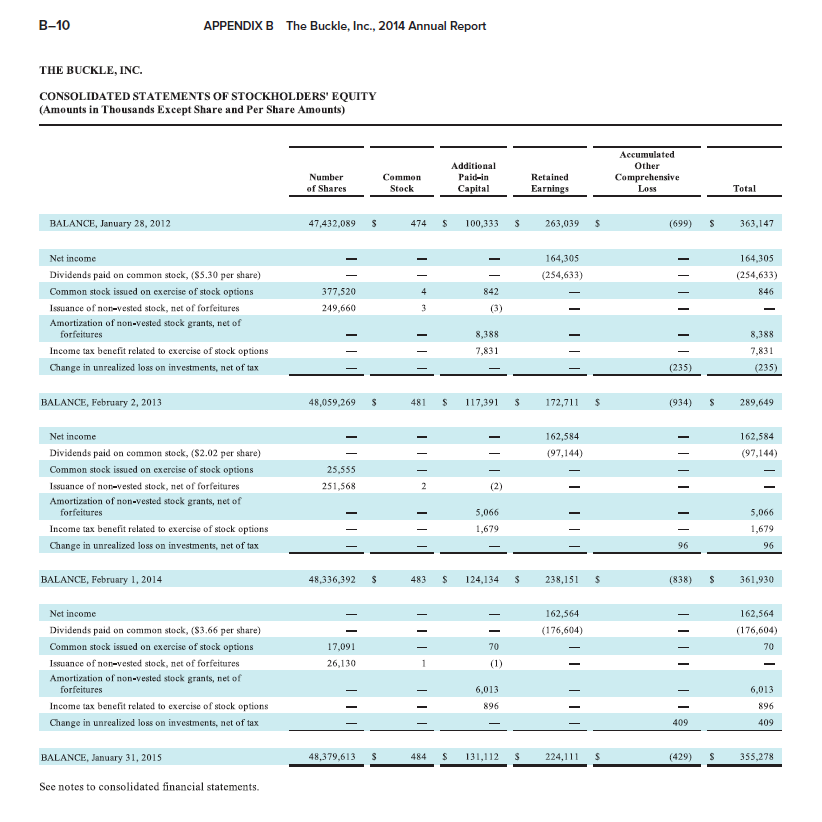
3) Prepare a Financial Risk Analysis by calculating for each company the:
a) debt to equity ratio b) return on equity c) interest coverage ratio*
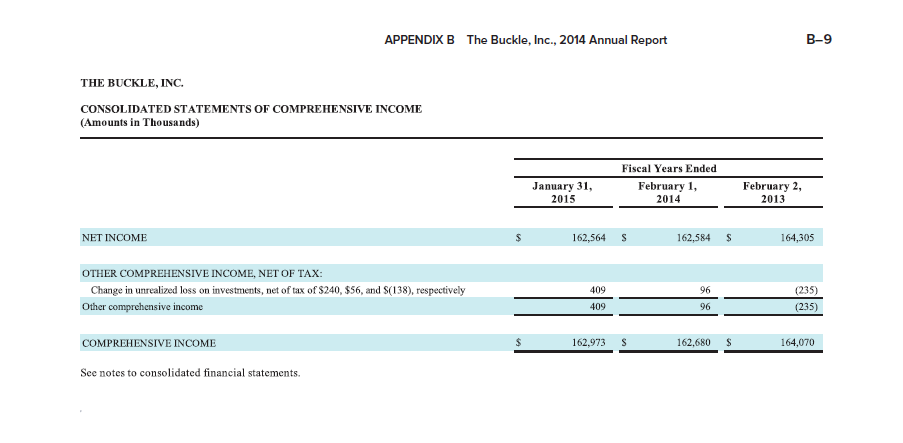
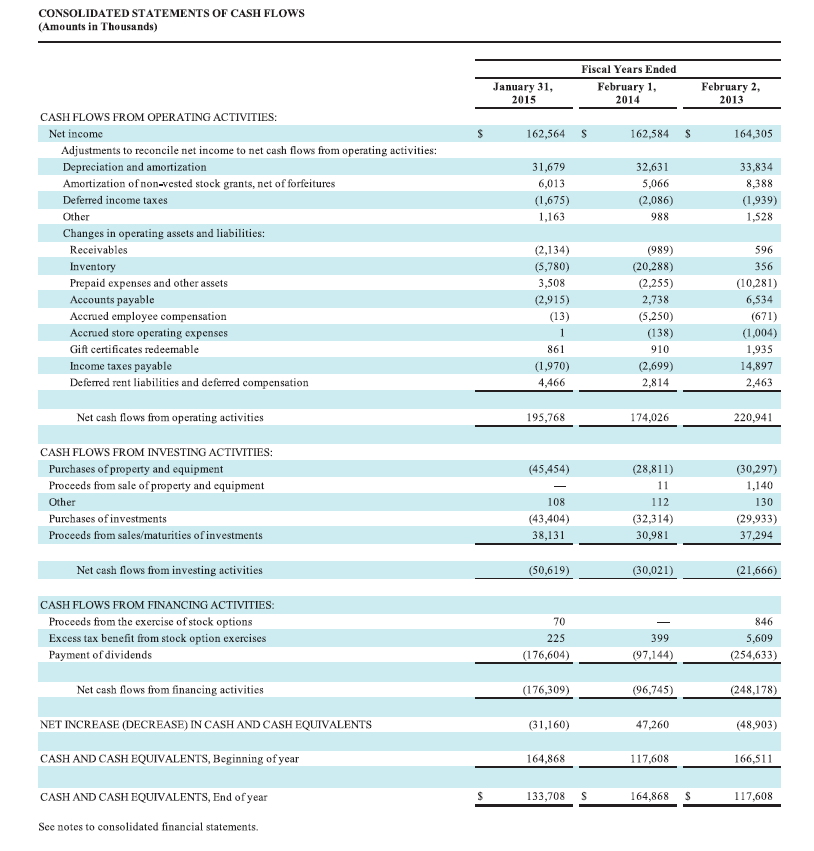
4) Prepare a Liquidity Analysis by calculating for each company the cash flow yield
a) Cash flows to sales b) Cash flows to assets c) Free cash flows
5) Prepare An Analysis Of Market Strength by calculating for each company the:
a) price/earnings ratio
b) dividend yield
6) Once you have completed the first 5 steps, write a 1-2 page analysis of the Buckle . What is the strengths, weaknesses, etc.? Why would you invest ot not?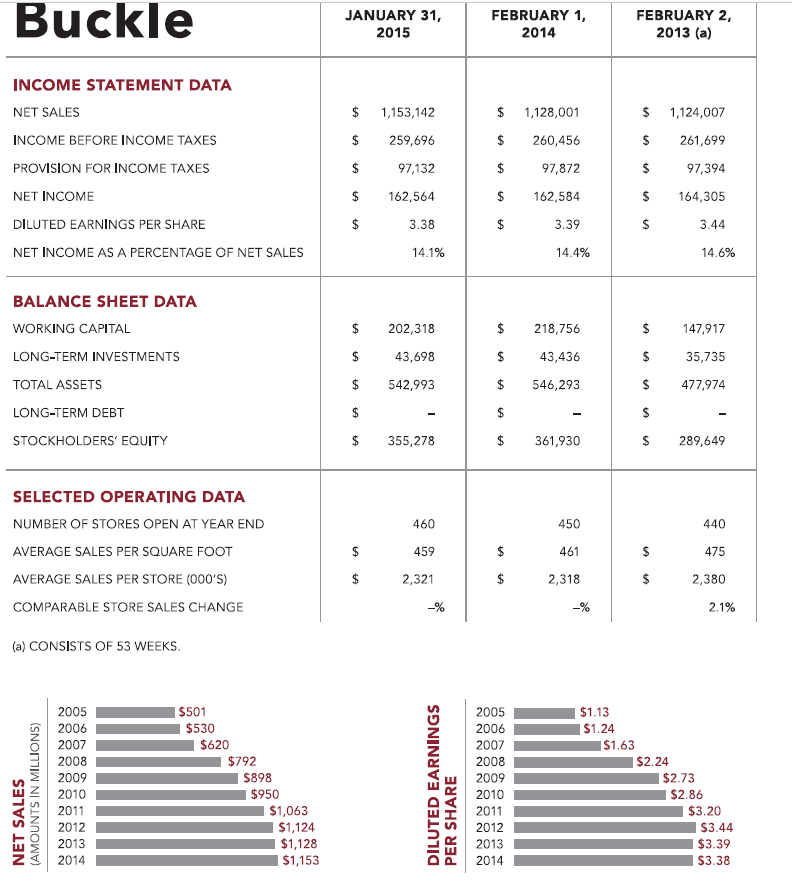
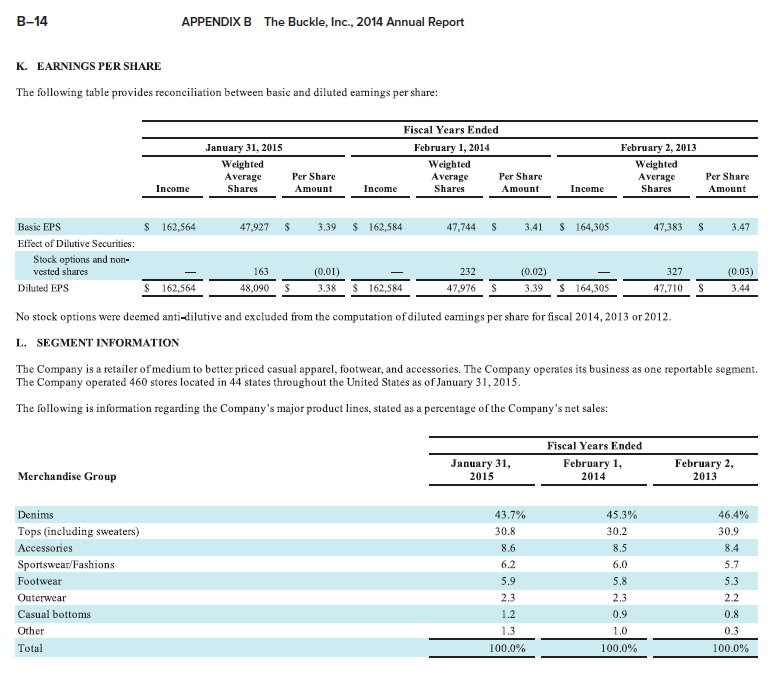
Buckle JANUARY 31, 2015 FEBRUARY 1, 2014 FEBRUARY 2 2013 (a) INCOME STATEMENT DATA NET SALES INCOME BEFORE INCOME TAXES PROVISION FOR INCOME TAXES NET INCOME DILUTED EARNINGS PER SHARE NET INCOME AS A PERCENTAGE OF NET SALES $1,153,142 $259,696 97,132 $162,564 3.38 $1,128,001 $260,456 97,872 $162,584 3.39 S 1,124,007 S261,699 97,394 $ 164,305 3.44 14.4% 14.6% BALANCE SHEET DATA WORKING CAPITAL LONG-TERM INVESTMENTS TOTAL ASSETS LONG-TERM DEBT STOCKHOLDERS' EQUITY $ 202,318 43,698 $542,993 $218,756 43,436 $546,293 147,917 35,735 S477,974 $ 355,278 $ 361,930 S289,649 SELECTED OPERATING DATA NUMBER OF STORES OPEN AT YEAR END AVERAGE SALES PER SQUARE FOOT AVERAGE SALES PER STORE (000'S) COMPARABLE STORE SALES CHANGE 460 459 2,321 440 475 2,380 450 2,318 21% (a) CONSISTS OF 53 WEEKS $1.13 2005 2007 2008 W2009 2005 $501 Z 2006$1.24 O 2007 $620 S1.63 2008 2009 | 2010 $792 $2.24 $898 $2.73 | 2010 U2011 $950 $2.86 $3.20 2012 2013 Z 2014 S1,124 $1,128 $1,153 2012 2013 $3.44 $3.39
Step by Step Solution
There are 3 Steps involved in it

Get step-by-step solutions from verified subject matter experts