

Question: 1 . Problem 1 The table below shows the sieve analysis results for an aggregate sample. ( In picture ) a ) Calculate the cumulative
Problem
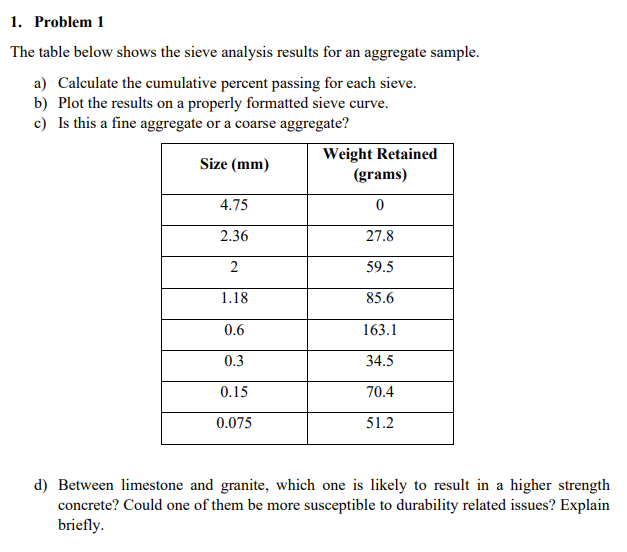
The table below shows the sieve analysis results for an aggregate sample. In picture
a Calculate the cumulative percent passing for each sieve.
b Plot the results on a properly formatted sieve curve.
c Is this a fine aggregate or a coarse aggregate?
d Between limestone and granite, which one is likely to result in a higher strength concrete? Could one of them be more susceptible to durability related issues? Explain briefly.
Step by Step Solution
There are 3 Steps involved in it
1 Expert Approved Answer
Step: 1 Unlock

Question Has Been Solved by an Expert!
Get step-by-step solutions from verified subject matter experts
Step: 2 Unlock
Step: 3 Unlock