

Question: 1 Problem Summary You are working at an engineering company called Muhendis, Inc.. Your boss, Kartal, asks you to evaluate a project which would bring
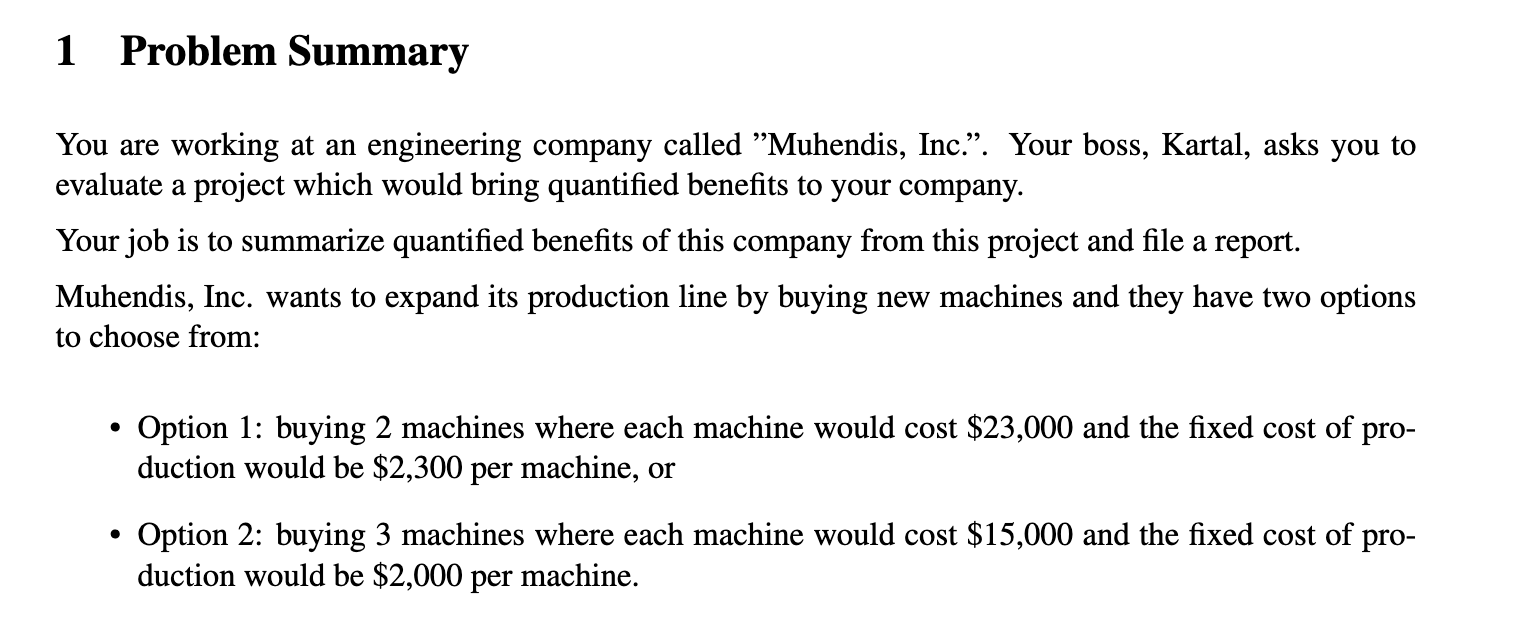
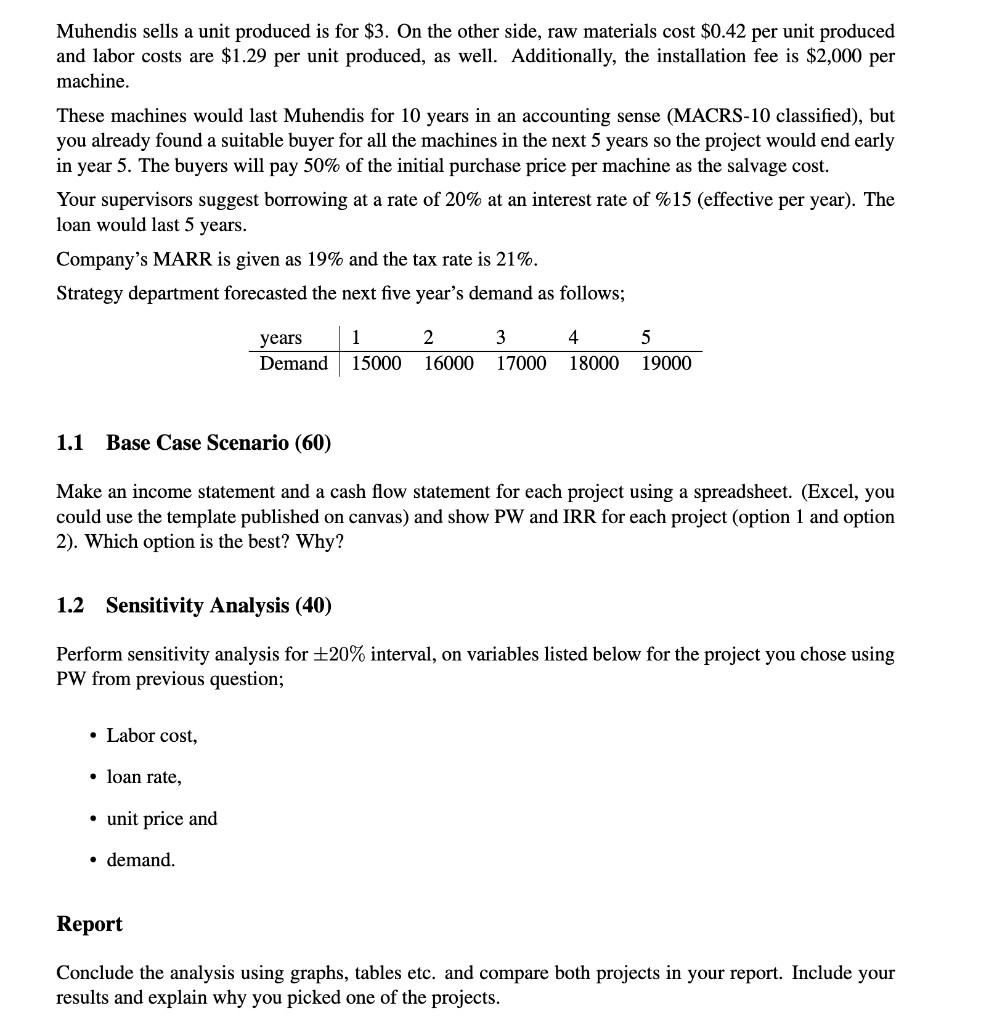
1 Problem Summary You are working at an engineering company called "Muhendis, Inc.". Your boss, Kartal, asks you to evaluate a project which would bring quantified benefits to your company. Your job is to summarize quantified benefits of this company from this project and file a report. Muhendis, Inc. wants to expand its production line by buying new machines and they have two options to choose from: Option 1: buying 2 machines where each machine would cost $23,000 and the fixed cost of pro- duction would be $2,300 per machine, or O Option 2: buying 3 machines where each machine would cost $15,000 and the fixed cost of pro- duction would be $2,000 per machine. Muhendis sells a unit produced is for $3. On the other side, raw materials cost $0.42 per unit produced and labor costs are $1.29 per unit produced, as well. Additionally, the installation fee is $2,000 per machine. These machines would last Muhendis for 10 years in an accounting sense (MACRS-10 classified), but you already found a suitable buyer for all the machines in the next 5 years so the project would end early in year 5. The buyers will pay 50% of the initial purchase price per machine as the salvage cost. Your supervisors suggest borrowing at a rate of 20% at an interest rate of %15 (effective per year). The loan would last 5 years. Company's MARR is given as 19% and the tax rate is 21%. Strategy department forecasted the next five year's demand as follows; years Demand 1 15000 2 16000 3 17000 4 18000 5 19000 1.1 Base Case Scenario (60) Make an income statement and a cash flow statement for each project using a spreadsheet. (Excel, you could use the template published on canvas) and show PW and IRR for each project (option 1 and option 2). Which option is the best? Why? 1.2 Sensitivity Analysis (40) Perform sensitivity analysis for +20% interval, on variables listed below for the project you chose using PW from previous question; Labor cost, loan rate, unit price and demand. Report Conclude the analysis using graphs, tables etc. and compare both projects in your report. Include your results and explain why you picked one of the projects. 1 Problem Summary You are working at an engineering company called "Muhendis, Inc.". Your boss, Kartal, asks you to evaluate a project which would bring quantified benefits to your company. Your job is to summarize quantified benefits of this company from this project and file a report. Muhendis, Inc. wants to expand its production line by buying new machines and they have two options to choose from: Option 1: buying 2 machines where each machine would cost $23,000 and the fixed cost of pro- duction would be $2,300 per machine, or O Option 2: buying 3 machines where each machine would cost $15,000 and the fixed cost of pro- duction would be $2,000 per machine. Muhendis sells a unit produced is for $3. On the other side, raw materials cost $0.42 per unit produced and labor costs are $1.29 per unit produced, as well. Additionally, the installation fee is $2,000 per machine. These machines would last Muhendis for 10 years in an accounting sense (MACRS-10 classified), but you already found a suitable buyer for all the machines in the next 5 years so the project would end early in year 5. The buyers will pay 50% of the initial purchase price per machine as the salvage cost. Your supervisors suggest borrowing at a rate of 20% at an interest rate of %15 (effective per year). The loan would last 5 years. Company's MARR is given as 19% and the tax rate is 21%. Strategy department forecasted the next five year's demand as follows; years Demand 1 15000 2 16000 3 17000 4 18000 5 19000 1.1 Base Case Scenario (60) Make an income statement and a cash flow statement for each project using a spreadsheet. (Excel, you could use the template published on canvas) and show PW and IRR for each project (option 1 and option 2). Which option is the best? Why? 1.2 Sensitivity Analysis (40) Perform sensitivity analysis for +20% interval, on variables listed below for the project you chose using PW from previous question; Labor cost, loan rate, unit price and demand. Report Conclude the analysis using graphs, tables etc. and compare both projects in your report. Include your results and explain why you picked one of the projects
Step by Step Solution
There are 3 Steps involved in it

Get step-by-step solutions from verified subject matter experts