

Question: 1. Produce 5 different types of data visualizations using ggplot, plotly and ggplotly. Produce the ggplotly plot using stock prices. Please produce a graph
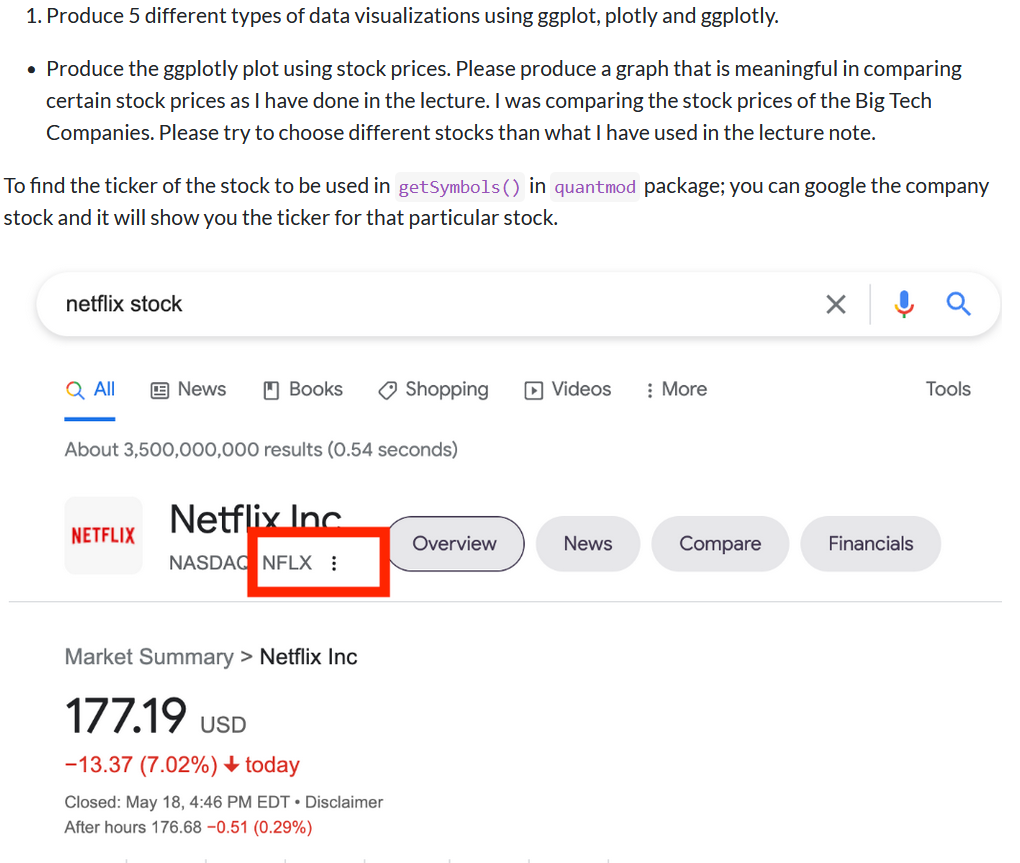
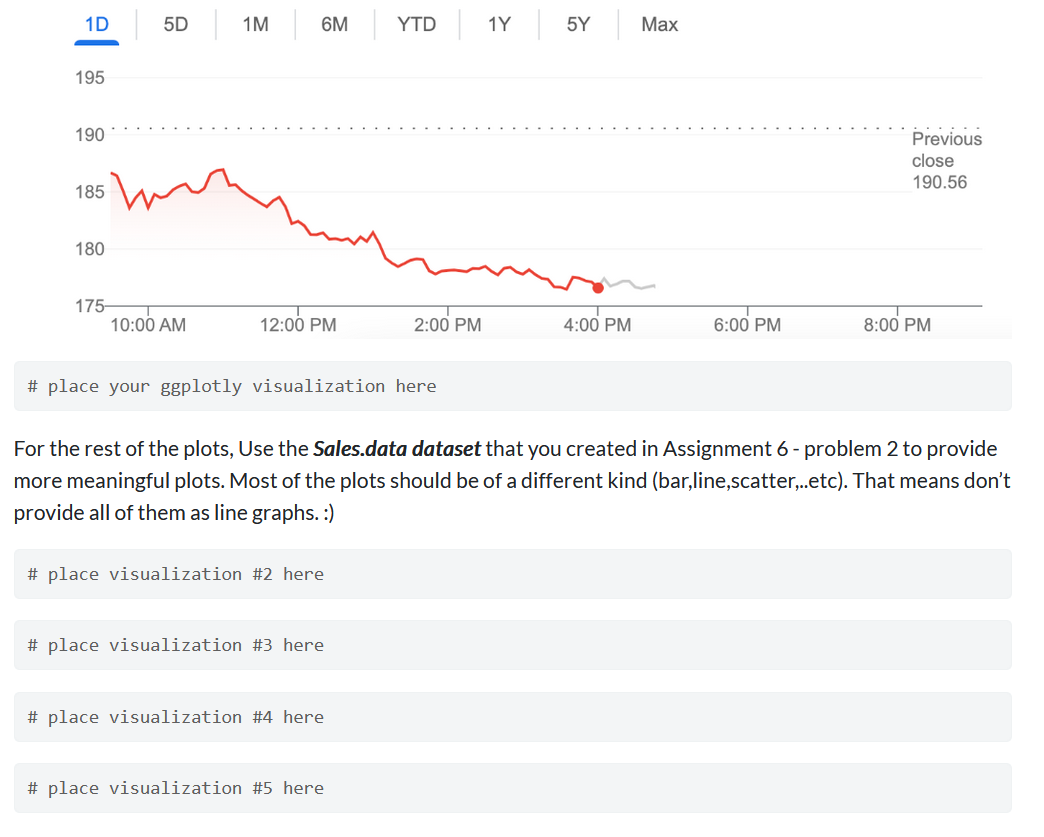
1. Produce 5 different types of data visualizations using ggplot, plotly and ggplotly. Produce the ggplotly plot using stock prices. Please produce a graph that is meaningful in comparing certain stock prices as I have done in the lecture. I was comparing the stock prices of the Big Tech Companies. Please try to choose different stocks than what I have used in the lecture note. To find the ticker of the stock to be used in getSymbols () in quantmod package; you can google the company stock and it will show you the ticker for that particular stock. netflix stock Q Q All News Books Shopping Videos More Tools About 3,500,000,000 results (0.54 seconds) Netflix Inc NETFLIX Overview News Compare Financials NASDAQ NFLX : Market Summary > Netflix Inc 177.19 USD -13.37 (7.02%) + today Closed: May 18, 4:46 PM EDT Disclaimer After hours 176.68 -0.51 (0.29%) 1D 5D 1M 6M YTD 1Y 195 190 185 180 K 5Y Max Previous close 190.56 175- 10:00 AM 12:00 PM 2:00 PM 4:00 PM 6:00 PM 8:00 PM # place your ggplotly visualization here For the rest of the plots, Use the Sales.data dataset that you created in Assignment 6 - problem 2 to provide more meaningful plots. Most of the plots should be of a different kind (bar,line,scatter,..etc). That means don't provide all of them as line graphs. :) # place visualization #2 here # place visualization #3 here # place visualization #4 here # place visualization #5 here Problem 2: a. Produce a wordcloud using the Harry Potter Corpus ("HP_Corpus"). Write one or two sentences explaining what you observe by this WordCloud. # insert code here Insert observations here b. Using the Harry Potter Corpus, which are the top five most used words in the corpus after stop words were removed? Insert words here c. Whose name appears more frequently in the Harry Potter Corpus, Ron's or Hermione's? Insert name here Problem 3 Watch this video on Mixtape Medley with Ariana Grande and Kelly Clarkson in Jimmy Fallon's Show. https://www.youtube.com/watch?v=LF_EF8Rj9gs Use Spotify's API to do a comparison between Ariana Grande's and Kelly Clarkson's music using several data visualization. # insert code here Please provide a description of your observations from the aforementioned video and your data visualization. Insert observations here
Step by Step Solution
There are 3 Steps involved in it

Get step-by-step solutions from verified subject matter experts