

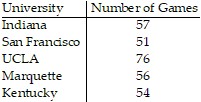
Question: 1. Provide an appropriate response. Use a scatter plot to display the data below. All measurements are in milligrams per cigarette. Universit V lumber of
1. Provide an appropriate response.
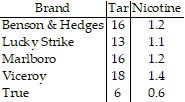
Use a scatter plot to display the data below. All measurements are in milligrams per cigarette.

Step by Step Solution
There are 3 Steps involved in it
1 Expert Approved Answer
Step: 1 Unlock

Question Has Been Solved by an Expert!
Get step-by-step solutions from verified subject matter experts
Step: 2 Unlock
Step: 3 Unlock