

Question: Use a scatter plot to display the data below. All measurements are in milligrams per cigarette. Universit V lumber of Games Indiana 57 San Francisco
Use a scatter plot to display the data below. All measurements are in milligrams per cigarette.
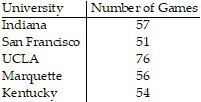
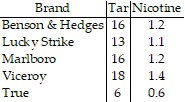

Universit V lumber of Games Indiana 57 San Francisco 51 UCLA 76 Marquette 56 Kentucky 54Brand Tar Ni otine Benson & Hedges 16 1.2 Lucky Strike 13 1.1 Marlboro 16 1.2 Vicerov 18 1.4 True1972 1973 1974 1975 1976 1977 1978 1979 1980 1981 190 186 167 162 167 168 165 155 154 147
Step by Step Solution
There are 3 Steps involved in it
1 Expert Approved Answer
Step: 1 Unlock

Question Has Been Solved by an Expert!
Get step-by-step solutions from verified subject matter experts
Step: 2 Unlock
Step: 3 Unlock