

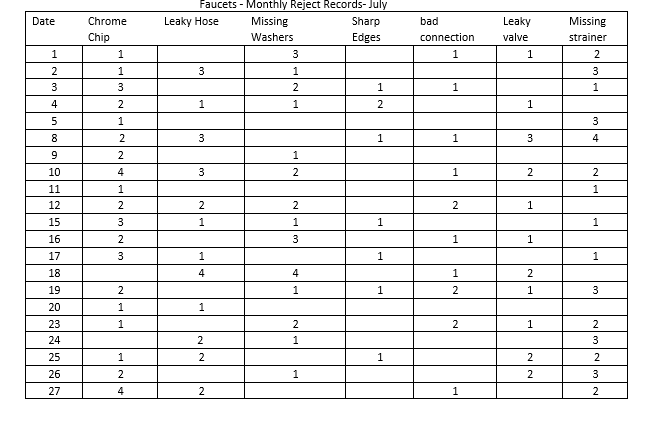
Question: 1. Put the data into a Pareto table that shows the actual numbers of defects, the percentages and cumulative percentages. From this table, compile a
1. Put the data into a Pareto table that shows the actual numbers of defects, the percentages and cumulative percentages. From this table, compile a Pareto Graph that includes the cumulative percent line for the monthly Reject Log of the Assembly Process. Use formulas for all calculations. Ensure that your tables and graphs are correctly labelled as well as both axes.Ensure they are properly formatted
2. Draw a Run Chart (Line Chart) for each of the top 2 defects indicated on your Pareto Chart, using the monthly reject data. A run chart will have the date on the X axis and the number of daily defects on the Y axis. In summary, a chart for each of the top 2 defects (2 charts required). (5 marks)
 Complete a Fishbone Diagram for the Quality problems at Faucet Town.
3. Include one Text box in which you provide your TWO recommendations for Faucet Town in order to improve their Quality Problems. Consider what you have learned in our unit on Quality. Maximum one paragraph each. (5 marks)
Faucets - Monthly Reject Records-July
Step by Step Solution
There are 3 Steps involved in it

Get step-by-step solutions from verified subject matter experts