

Question: 1. Refer to the dataset (below). This dataset presents data from 32 children with a chronic lung disease who underwent an annual chest CT, followed

1.
Refer to the dataset (below).
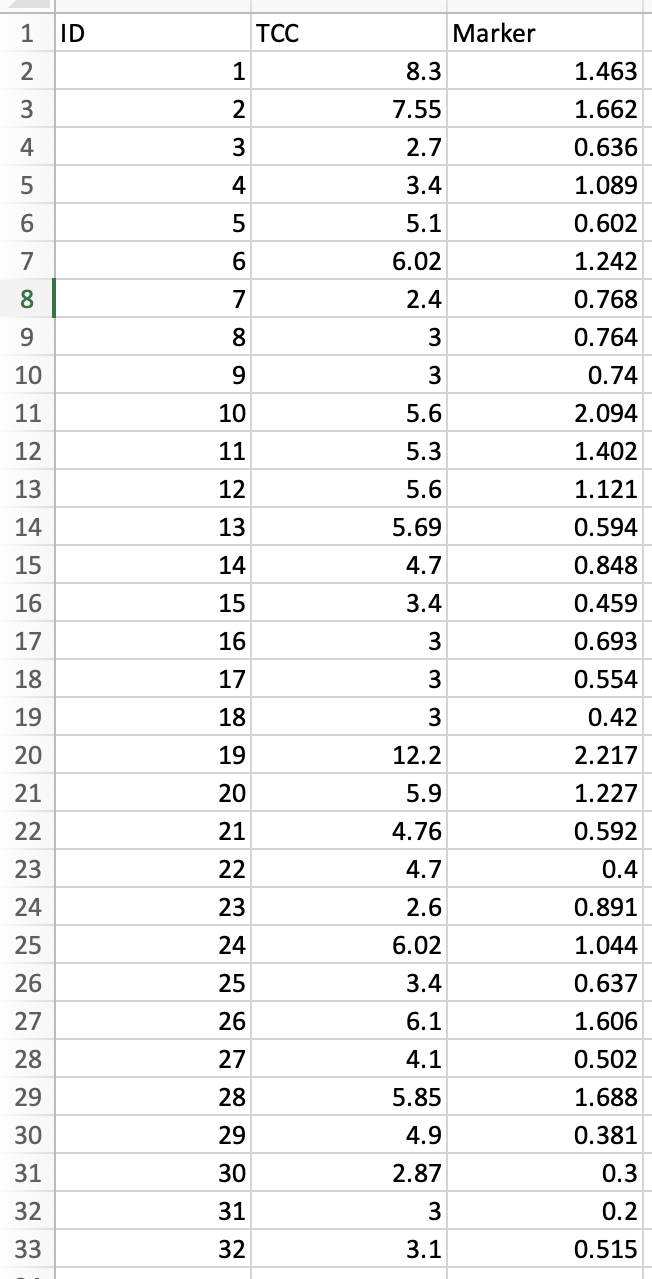
This dataset presents data from 32 children with a chronic lung disease who underwent an annual chest CT, followed by bronchoscopy with bronchoalveolar lavage fluid collection. The bronchoalveolar lavage fluid was analyzed for the concentrations of a specific biomarker using mass spectrometry.
Variables in this data include:
ID: Subject ID (1 to 32)
TCC: Total cell count (all cells in bronchoalveolar lavage fluid)
Marker: Level of specific biomarker metabolites (m/z) measured by mass spectrometry
1a.
Investigators are interested in whether the level of biomarker metabolites (Marker) helps to predict total cell count (TCC).
Explore the relationship between the two variables using a scatterplot, with Marker on the x -axis.
Describe the relationship between level of biomarker metabolites and total cell count.
1b.
Calculate the correlation coefficient for the level of biomarker metabolites and total cell count.
Display any code you used and output from the state software.
Describe the strength of the correlation.
1c.
Can the relationship observed in part (b) be explained by chance? Justify your answer by performing a hypothesis test (include all the usual steps for this hypothesis test)
Step by Step Solution
There are 3 Steps involved in it

Get step-by-step solutions from verified subject matter experts