

Question: 1. Return to Lab 2, V1 . Define success for your qualitative data to be the category with the largest relative frequency from your Lab
1. Return to Lab 2, V1. Define "success" for your qualitative data to be the category with
the largest relative frequency from your Lab 2 Part 1A table. ______________________
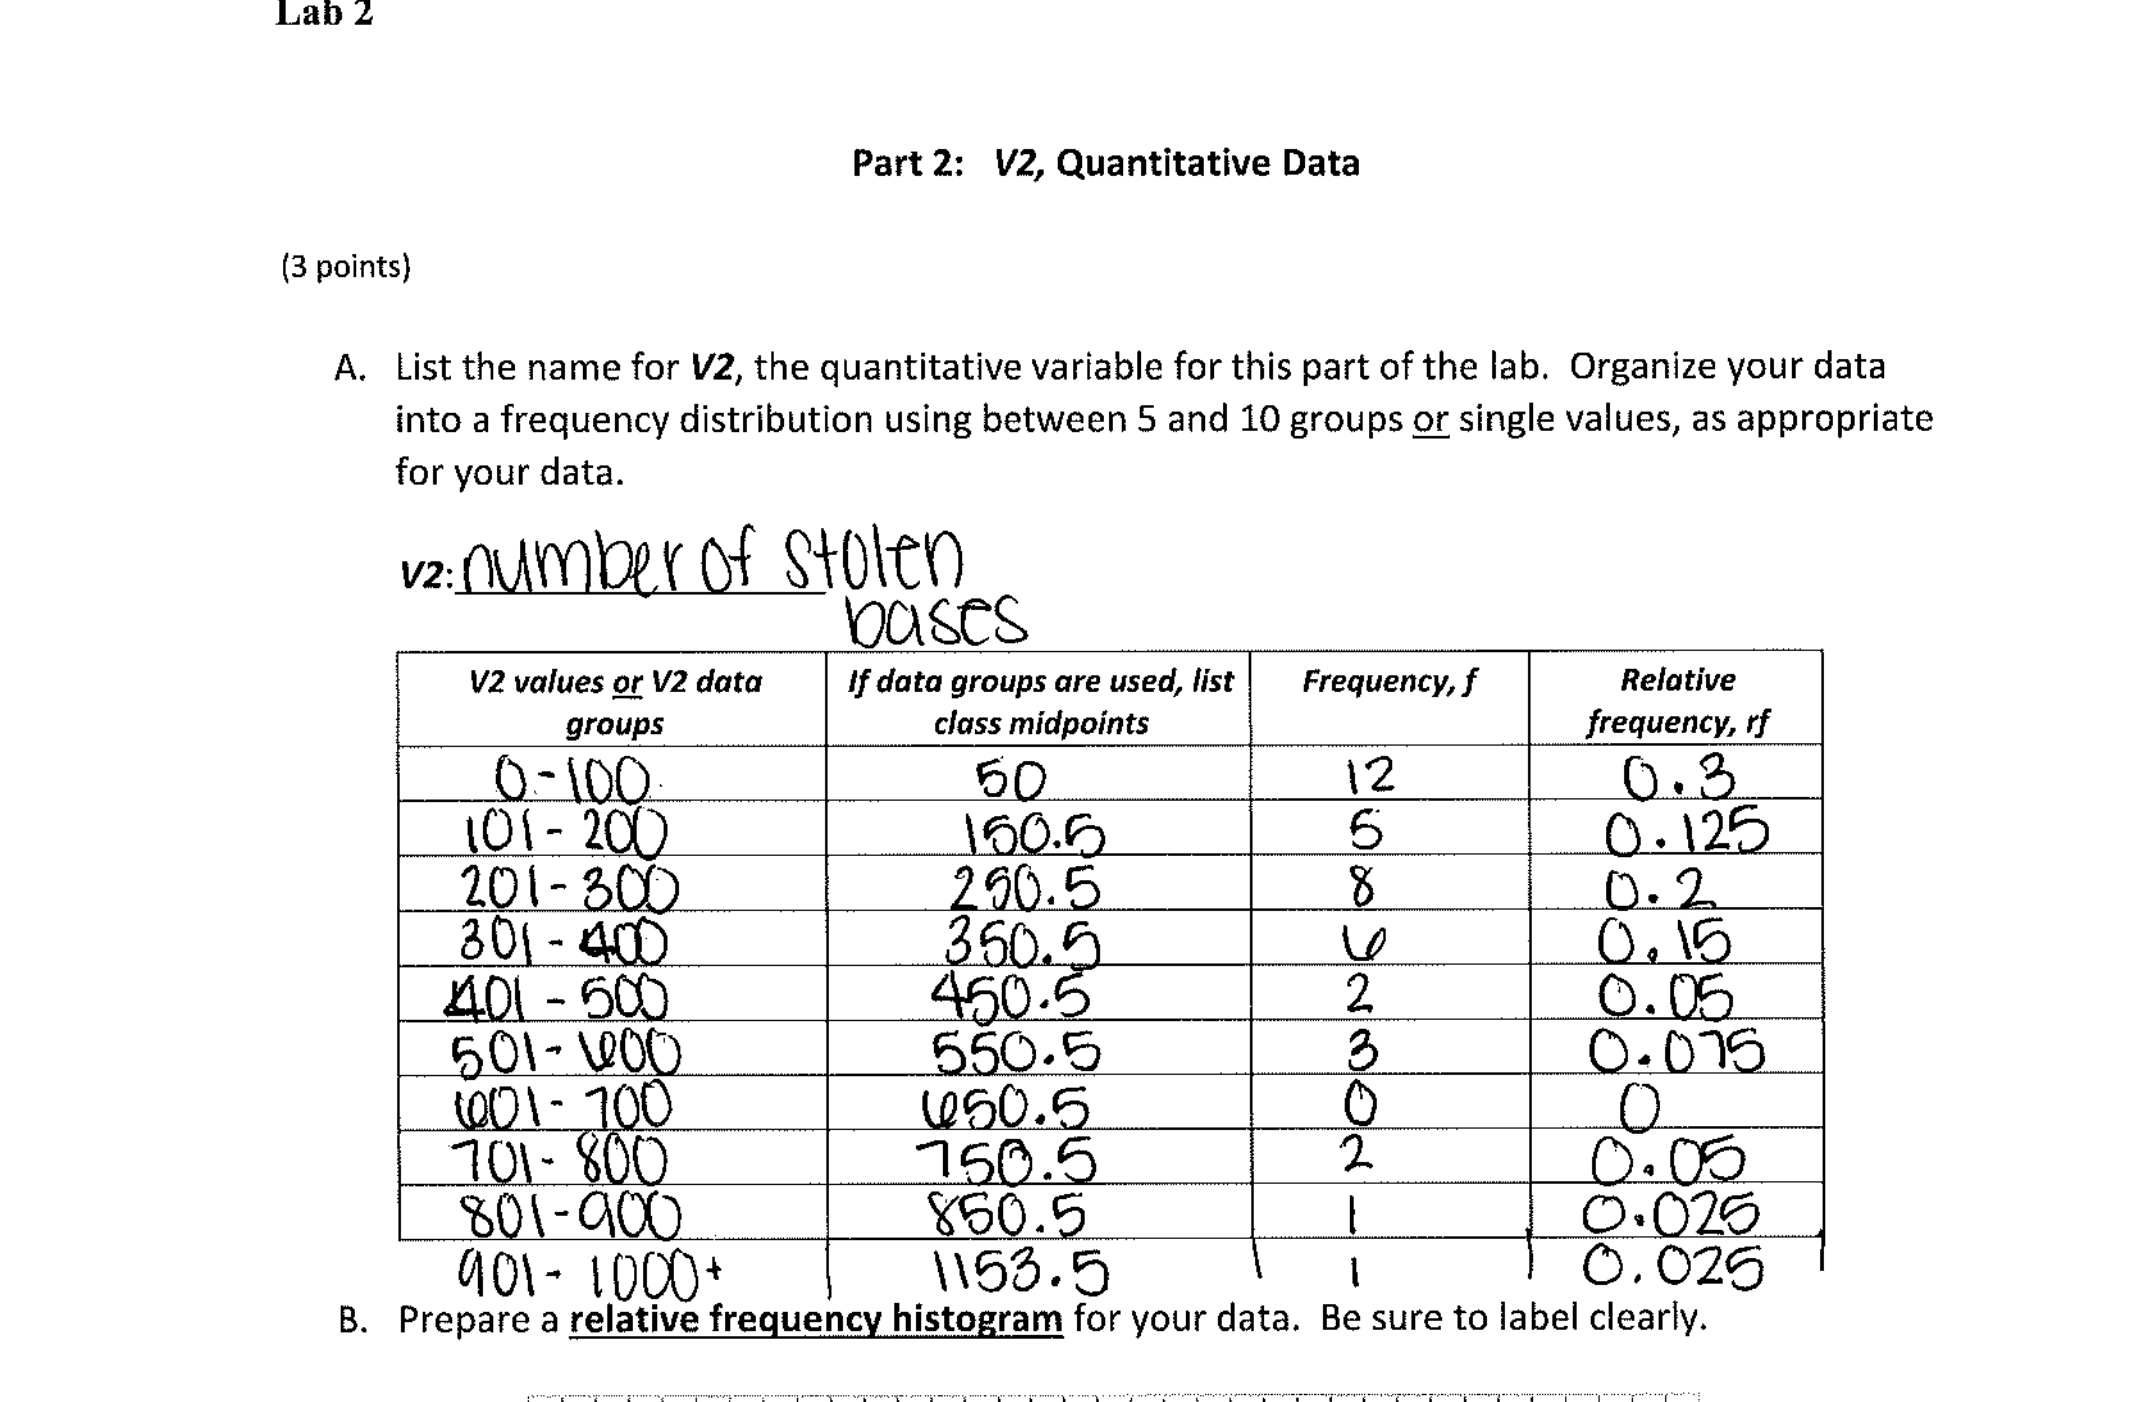
Lab 2 Part 2: V2, Quantitative Data (3 points) A. List the name for V2, the quantitative variable for this part of the lab. Organize your data into a frequency distribution using between 5 and 10 groups or single values, as appropriate for your data. v2 : number of stolen bases V2 values or V2 data If data groups are used, list Frequency, f Relative groups class midpoints frequency, rf 0- 100 50 12 0 . 3 101- 200 160.5 0 . 125 201-300 250.5 8 0. 2 301 - 400 350.5 0 . 15 401 - 500 450.5 2 0. 05 501-100 550.5 3 0 . 075 101 - 700 (050.5 701- 800 750.5 2 0. 05 801 -900 850.5 0. 025 901- 100 0+ 1153.5 - 0. 026 B. Prepare a relative frequency histogram for your data. Be sure to label clearly
Step by Step Solution
There are 3 Steps involved in it

Get step-by-step solutions from verified subject matter experts